Managing Alert Policies
Alert policies enable you to define watch conditions within your datacenter, and create custom alerts to trigger based on set thresholds and time periods. Policy Administration includes:
Adding/Editing an Alert Policy
Alert policies are intended to be independently activated and alerted on. Once you choose what to watch in your datacenter, you can receive actionable information through alert notifications. This same information can be viewed on-demand through the different Alert reports - where events can be captured and drilled into for root-cause analysis. See
Alert Reports.
An Alert Policy is comprised of multiple sections accessed through a workflow wizard. An Alert policy is divided into four steps:
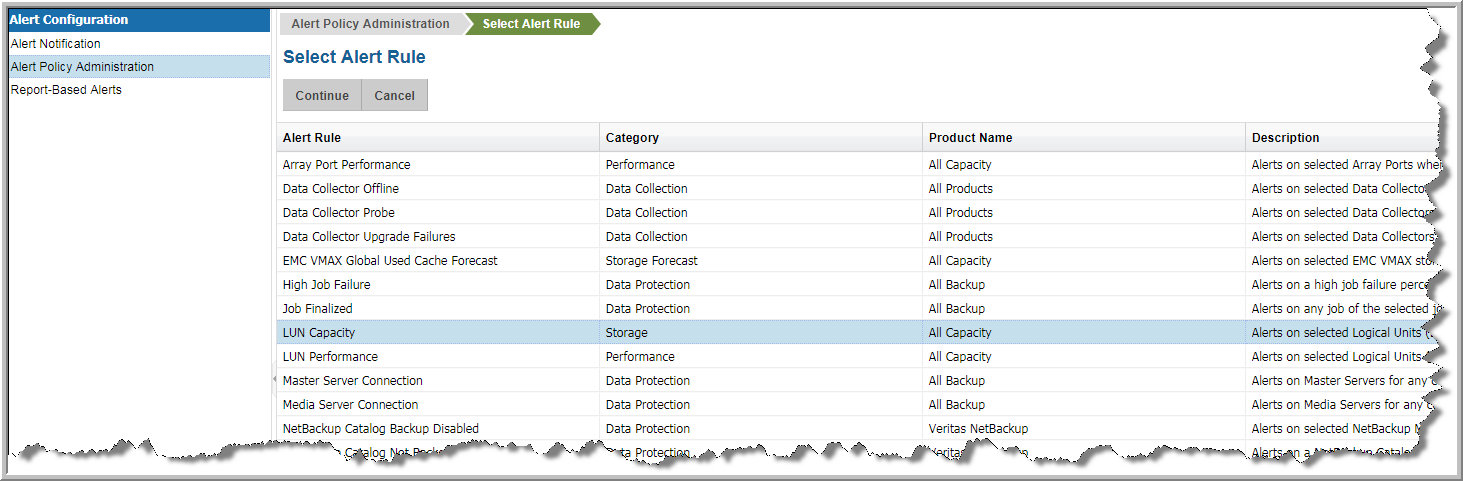
Select an Alert Rule
Choosing the
Alert Rule is the first step in creating an Alert Policy. Alert Rules serve as templates and once you include the configurable parameters to isolate specific conditions, save the custom instance of the rule and create the Alert Policy. See
Alert Rules.
1. Navigate to Alerts>Alert Configuration>Alert Policy Administration.
2. Click Add.
APTARE IT Analytics provides a pre-defined set of monitoring rules to examine areas within your enterprise to monitor. These rules include configurable parameters to isolate specific conditions relevant for your environment. Many Alert Policies can be created from each Alert Rule.
Once the rule is selected, customize the Policy details to define the scope of what you’d like to monitor, such as a specific product or job types, the frequency of the symptom and alerting thresholds.
Name the Policy and Define Time Intervals
To start creating the Alert Policy, assign a name, define the frequency of the symptom you are monitoring, and modify the schedule if required.
Field | Description |
Alert Policy Name | Enter a name for the Alert Policy. This a required field. |
Active | Select to activate the policy. To avoid unnecessary notifications, deactivate Alert Policies when there are situations such as planned outages or scheduled maintenance. You can also suppress alerts from the
Alert Detail report. |
Symptom Frequency | Choose the frequency of the symptom. For example, do you want to be alerted every time the symptom occurs, or if it happens 3 consecutive times, or 2 out of 4 times. You have the flexibility to customize the frequency so it’s relevant to your business case. |
Schedule | Some Rules are based on a schedule. If the selected Rule is based on a pre-defined schedule, that default schedule is displayed. Click the icon to overwrite the default. See
Scheduled Rules vs. Run Time Rules. |
Warning Alert | Select the pre-defined Alert to issue for a warning condition. This would be triggered when the threshold value for a Warning condition is reached. See
Adding an Alert Notification Delivery Method. |
Critical Alert | Select the pre-defined Alert to issue for a critical condition. This would be triggered when the threshold value for a Critical condition is reached. See
Adding an Alert Notification Delivery Method. |
Add Alert Notification | Click to setup the alert notification method as you are adding the Alert Policy. This can also be add outside of adding an alert policy. See
Adding an Alert Notification Delivery Method. |
Description | Add an optional description for the Alert Policy. |
Define the Scope to Monitor
Policy scope can be set to alert on a wide range of conditions or a specific granular one. This window enables you to:
• Double-click to add an object to the scope
• Double-click to remove an object from the scope - This removes an object that has been place in the report scope.
• Drag and drop objects into the scope - Click the object and move it until you see a red dotted rectangle. Drop it into the pane.
• Search for objects to add to the scope.
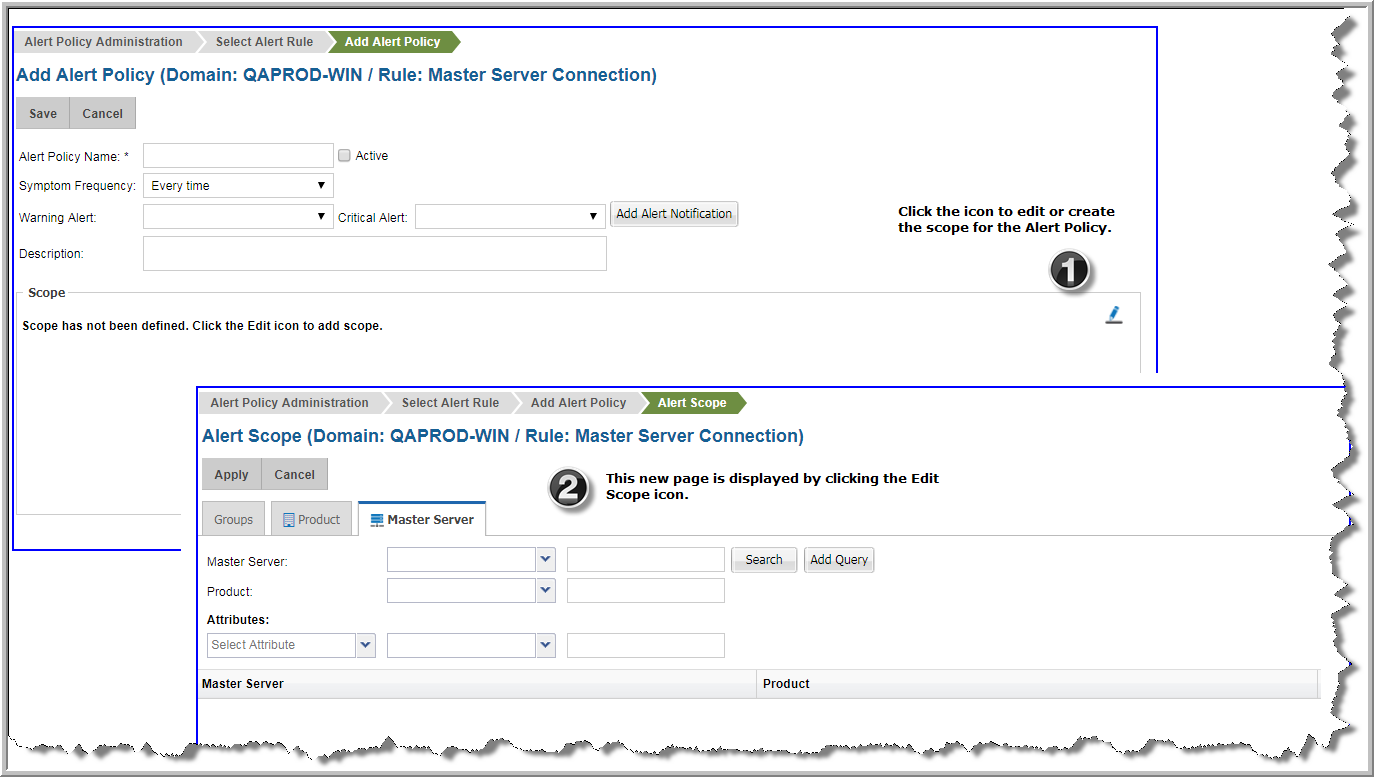
Once in the new screen, use the Groups tab to browse for a broad scope such as everything from a particular vendor. The benefit of a broad scope is that when new objects are added to your datacenter and they fit the scope criteria, they are picked up automatically by the Alert Policy.
Note: Alerting is configured at the Domain level, however for multi-tenancy environments, the
Cascade option in the
Groups tab impacts what objects are available to monitor. Select
Cascade to display objects at your Domain level and those domains that are children to your level. Deselect
Cascade to only display and monitor objects from your Domain.
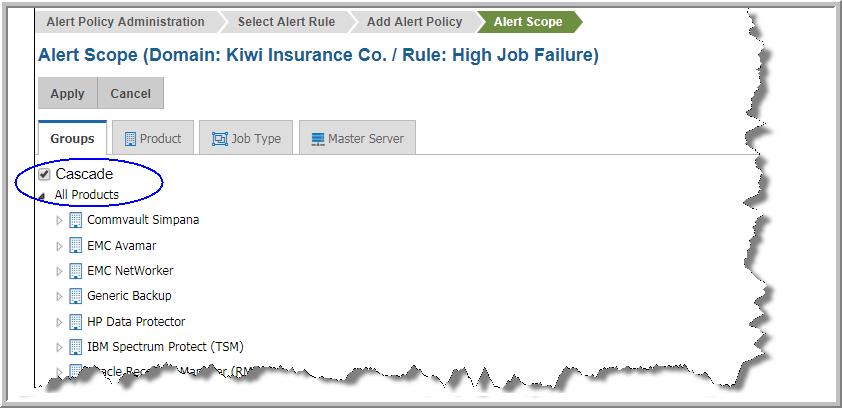
Use the searchable tabs to refine the scope to a more granular level, such as watch a specific set of master servers. For each object represented in the Groups tab, there is a corresponding searchable tab. The searchable tab selection is dynamic and derived from the Alert rule you select. For example, if you select Master Server Connection, the Groups tab displays all discovered products in your datacenter. The searchable tabs enable you to find Products and Master Servers. By using each of these components, you can construct a query to monitor exactly the scenario you require.
Attributes are also available to use as a scoping filter for most Rules. Attributes are user-defined characteristics of the objects.
Using Attributes in the Monitor Scope
Attributes, either user-defined or system attributes, can be used to when defining the scope of your alert. Attributes are available for selection from most Rules. For example, you have set up a “location” attribute that you associated with the Master Servers. With that set, you can generate an alert for Master Servers in a particular location that also fit your other scope criteria. An attribute can be added as a part of the monitor query. See
Managing Attributes and Objects for additional information about Attributes.
Use Show Resolved Scope to display a list of items in your datacenter that currently meet the selected criteria. This provides validation that the scope you set is capturing what you intended.
Scope Examples
The following examples illustrate a variety of scenarios using a sample set of Alert Rules. The intention is to describe how the feature works by example rather than a task-based approach.
Scope Example: Data Protection
Rule | High Job Failure Rate |
Scenario | Monitor all backup products in your datacenter that meet the threshold criteria for a failure percentage. This is a scheduled policy. |
1. Navigate to Alert>Alert Configuration>Alert Policy Administration.
2. Click Add.
3. Choose the Alert Rule: High Job Failure. Double-click or click Continue to advanced to the next screen.
5. Choose or create the notification for a
Warning and
Critical Alert. Alert Notifications must be defined before the Alert Policy is created to select them for alerts. You can also click
Add Alert Notification and define it when you configure the Alert Policy. See
Adding an Alert Notification Delivery Method.
6. Under the Scope heading, click the Edit icon.
7. Click Groups and select All Products. The benefit of selecting All Products is that when new vendors are added to your datacenter they are picked up automatically by the Alert Policy.
8. Under the Threshold Setting heading, click the Edit icon.
9. Set the threshold and click Active to define the trigger for an alert. In this example, choose the Operator as greater than or equal to and we’ll set a value of 50 to indicate a Job failure rate 50% is considered a Warning threshold and 80 to indicate a Critical threshold.
10. Enable the Alert Policy by clicking the Active checkbox beside the Alert Policy Name field.
11. Click Save. The Alert Policy is displayed on the Alert Policy Administration page.
Scope Example: Data Protection
Rule | Job Finalized |
Scenario | Monitor all backup jobs for your Tech Pubs department whose Master Server name contains NBU, and have an Exit Status Code of 123, 456, 789. However, you only care about the Exit Status Code if it happens 3 out of 5 times. This is a run-time policy. For the Job Finalized Alert Rule, Exit Status is a mandatory entry. |
1. Navigate to Alert>Alert Configuration>Alert Policy Administration.
2. Click Add.
3. Choose the Alert Rule: Job Finalized. Double-click or click Continue to advanced to the next screen.
5. Enter 3 of 5 to indicate you only want to trigger an alert if the symptom occurs 3 times out of 5.
6. Choose or create the notification for a
Warning and
Critical Alert. Alert Notifications must be defined before the Alert Policy is created to select them for alerts. You can also click
Add Alert Notification and define it when you configure the Alert Policy. See
Adding an Alert Notification Delivery Method.
Setup the Master Server Scope
7. Under the Scope heading, click the Edit icon.
8. Click the Master Server tab.
9. Choose the Operator
contains and enter
NBU in the field. Advanced Filter operators are available. Refer to
Advanced Filter Operators.
10. Click
Search to display all discovered Master Servers that contain NBU in the name field.
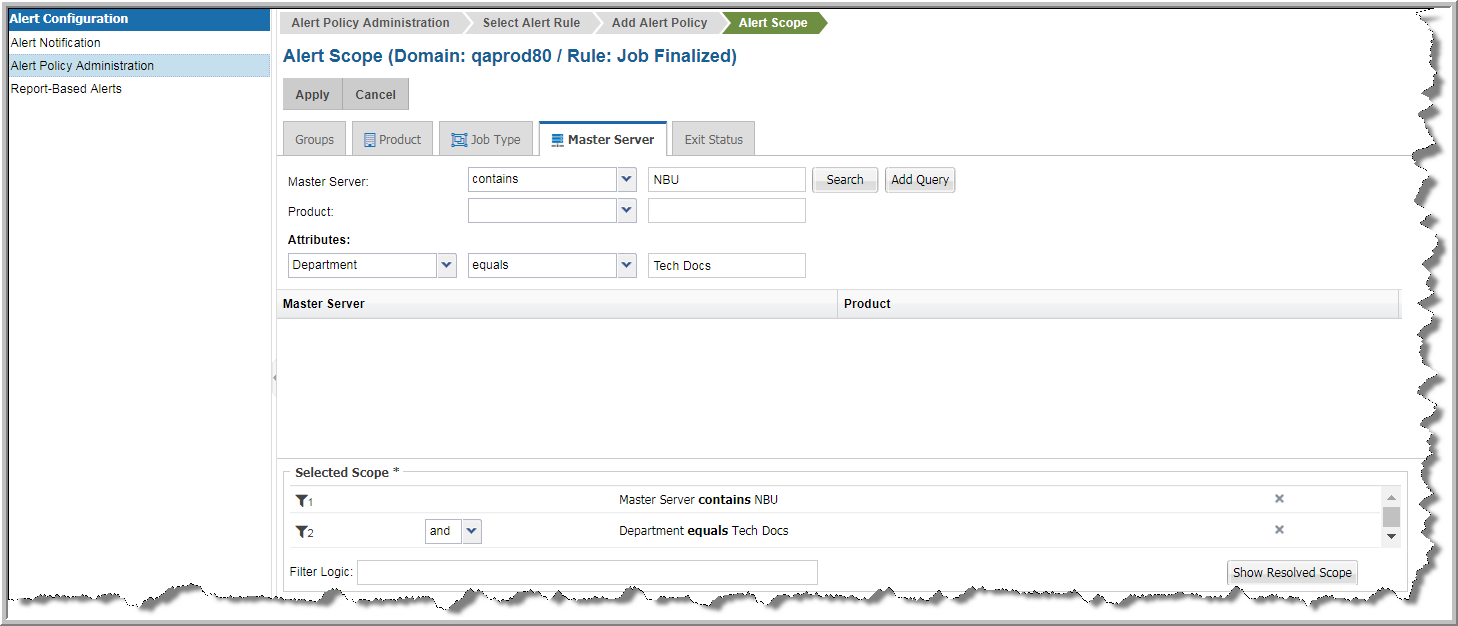
11. Click Add Query. This adds your filter selection as the first row in the Selected Scope. You could also drag and drop, or double click an individual Master Server to add it to the Selected Scope. For this example, we are adding all the values found in the Search.
12. Select Department under Attributes. Choose the Operator contains and enter Tech Docs in the field.
Note: Because the filter value is broad (NBU instead of an individual Master Server) when new Master Servers are added to your Tech Docs department and given the same NBU naming convention, they are automatically added to this Alert Policy scope.
Setup the Exit Code Scope
13. Click the Exit Status tab. For the Job Finalized Alert Rule, Exit Status is mandatory.
14. Choose the Operator
equals and enter
123, 456,789 in the field. Advanced Filter operators are available. Refer to
Advanced Filter Operators.
15. Click Add Query. This adds your filter selection as the next row in the Alert Policy Selected Scope.
If your query is multiple lines, you can use the Filter Logic field to customize the filter expression order and the operators. Logic defined in this field will override any setting established on the top of the dialog. Use the numbers on the left of the filter expressions to construct your Filter Logic.
Edit the logic using the filter numbers and by adding parentheses or changing the operators. For example, you can change “1 AND 2 OR 3” to “1 AND (2 OR 3)”.
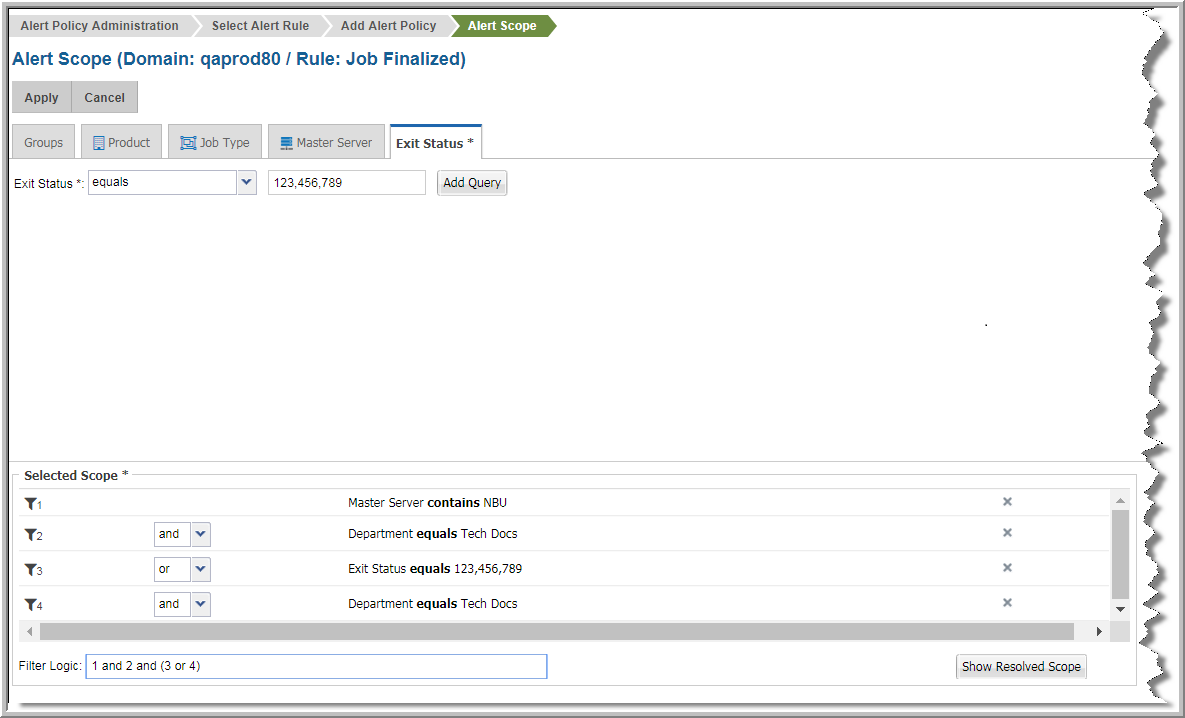
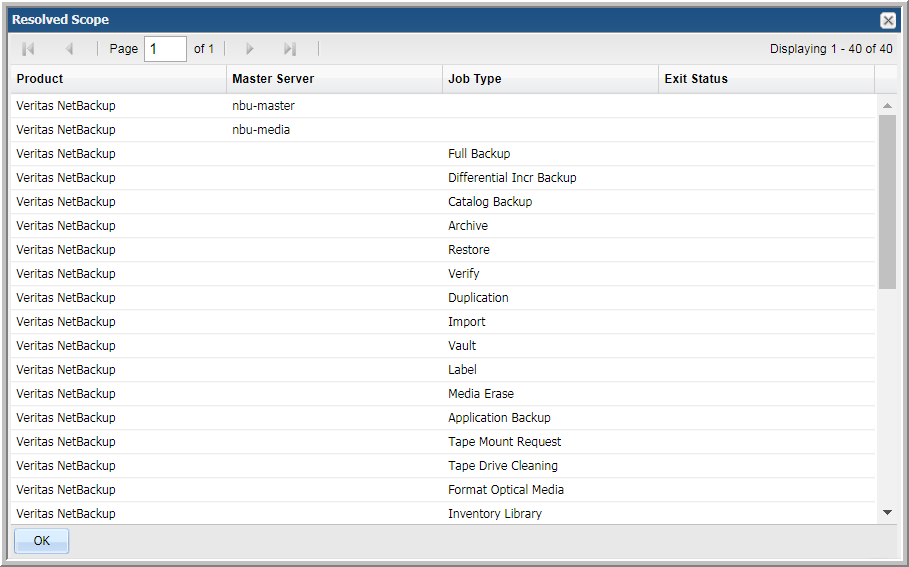
16. Click
Show Resolved Scope. This lists everything in your datacenter that meets the criteria defined in your Selected Scope.
17. Enable the Alert Policy by clicking the Active checkbox beside the Alert Policy Name field.
18. Click Save. The Alert Policy is displayed on the Alert Policy Administration page.
Set the Threshold for an Alert Rule
Some Rules have specific trigger thresholds to set for an alert. You can enter values that indicate a warning or a critical alert. The threshold availability is dependent on the Rule. If a threshold is displayed, enter the values to indicate what constitutes a warning alert and what is a critical alert. Thresholds must also be explicitly activated.
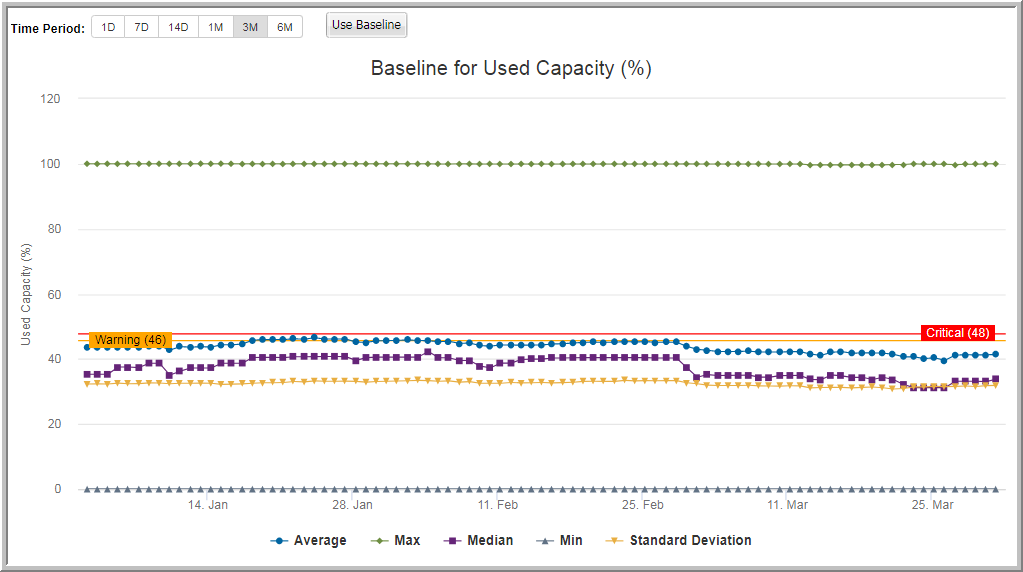
To help determine threshold values, you can view a baseline chart based on collected historical data to see where the numbers currently fall. Use this information to create your own threshold values or apply the historical baseline directly to your policy.
Show Baseline Example
The following example uses the Alert Rule VMware VM Guest Disk Capacity.
1. Enter a percentage value for the Warning Threshold. For example, if you’d like to know when your Used Capacity reaches 80%, enter 80 to trigger a warning alert. If the Alert policy is setup to recognize a warning threshold, when this value is reached, an alert could be issued.
2. Enter a percentage value for the Critical Threshold. For example, if you’d like to know when your Used Capacity reaches 90%, enter 90 to trigger a critical alert. If the Alert policy is setup to recognize a critical threshold, when this value is reached, an alert could be issued.
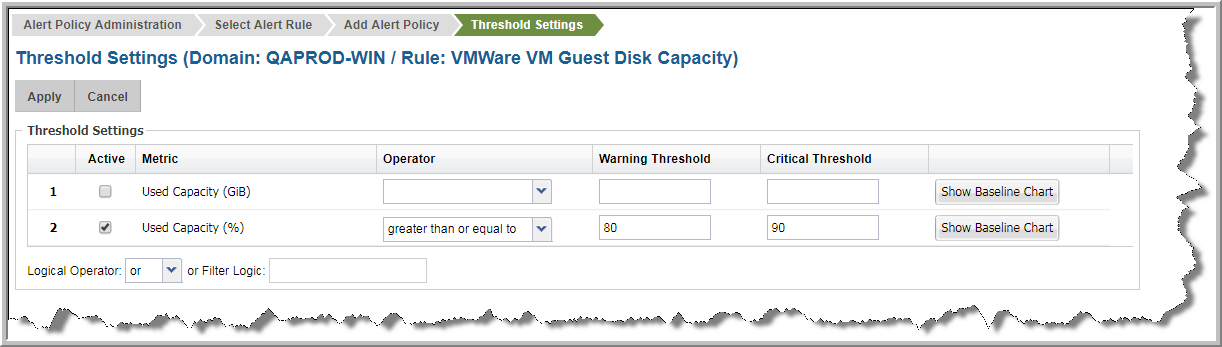
3. Click Show Baseline Chart to display a chart of historical data for the selected threshold for VM Guest Disks. The chart is based on your selected scope. You can adjust the Time Period as required to examine the historical results. This helps you to determine the numbers for your warning and critical thresholds. You can derive your own numbers from the data the create threshold values or apply the baseline numbers directly.
Copying an Alert Policy
Sometimes when you add an Alert Policy with a number of specific query parameters, you may want to modify one or two parameters without having to recreate the entire policy. Copy allows you use an existing Alert Policy as a template and create a new version that you can modify and save with another name.
1. Navigate to Alerts>Alert Configuration>Alert Policy Administration.
2. Select an Alert Policy and click Copy.
3. Enter a name for the new Alert Policy. The new Policy is displayed on the Alert Policy Administration page.
4. Select the new Alert Policy and click Edit.
5. Modify the parameters as required.
Deleting a Alert Policy
1. Navigate to Alerts>Alert Configuration>Alert Policy Administration.
2. Select an Alert Policy and click Delete. A confirmation dialog is displayed.