Format the SQL Template Output
1. Format fields in a report within the Formatting tab.
• Check the query fields to select the fields to be displayed in the report.
• Move fields up and down to position them in the report’s output.
• Modify the Label for the displayed fields to something more relevant to your needs.
2. Choose a Report Type:
Number, Size, Date, and Time Formatting
• These patterns are based on the Java classes
SimpleDateFormat and
NumberFormat. Note that the Date Formatter is no longer supported in the SQL Template Designer because the format of the date is controlled by the user’s profile.
• For special cases where custom date formatting is required, use the Oracle TO_CHAR function in the query. This function converts a date or interval value to a character data type in the specified format: Date, Timestamp.
• Negative values - Since the number format is based on Java formatters, you can use a semi-colon (;) sub-pattern boundary to represent negative numbers so that they stand out differently from positive values. See
Examples of Negative Value Formatting.
• For additional details about Java decimal formatters, see
DecimalFormat.
Examples of Negative Value Formatting
The following examples show how to use the semi-colon to represent the negative value, -1234.56.
• #,##0.00;(#,##0.00) displays the value, -1234.56, as (1,234.56)
• #,##0.00;'<font color=red>'(#,##0.00) displays the value, -1234.56, in red as (1,234.56)
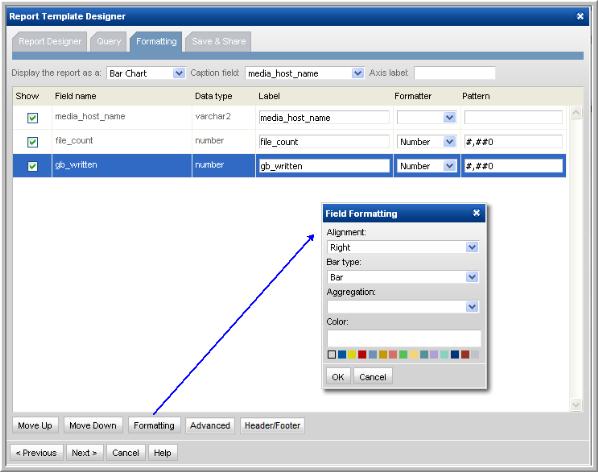
Alignment, Aggregation, Bar Type, and Bar Type Color
Select the Field and click Formatting (at the bottom of the window) to view the formatting options.
• Data alignment - Left, Center, or Right.
• Aggregation - Sum, Average, Minimum, Maximum
• Bar type - Bar or Line (for bar charts only)
• Color - Bar or Line (for bar charts only)
3. At the bottom of the Formatting window, use the Move Up and Move Down buttons to organize the fields in the order that you want them to appear in a tabular report. Be sure to select a row before shifting the fields.
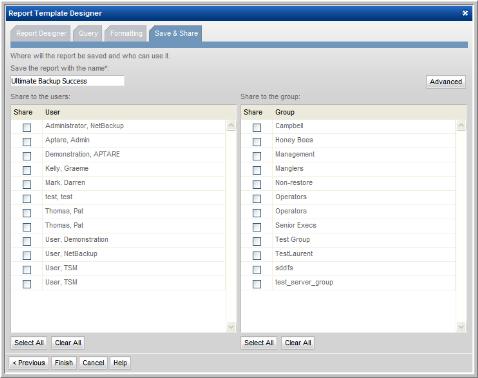
4. In the Save & Share window, complete the appropriate text boxes to save and share the report, then click OK. You can choose one or more users and user groups. The saved report template will be listed in the report group that you select.
Configuring a Header and Footer in a Custom Report Template
At the bottom of the Formatting window in the SQL Template Designer, click the Header/Footer button to launch the window where you can define the text and variables that will be displayed when the report is generated.
Any variables used in the query can be included in a header or footer, as shown in the above example.