Configure a Pivot Table SQL Template
A pivot table provides a useful mechanism for aggregating and summarizing data. In effect, you are taking the flat rows of data and grouping them into a multi-dimensional representation of the data, enabling easier data analysis. When formatting a Pivot Table, only three fields are used (row, column, and data). Use the Move Up and Move Down feature to position the fields to easily select three fields. See also:
Example of a Pivot Table SQL Template: NetBackup Job Size
The following example illustrates a key SQL Template Designer formatting feature—Pivot Tables.
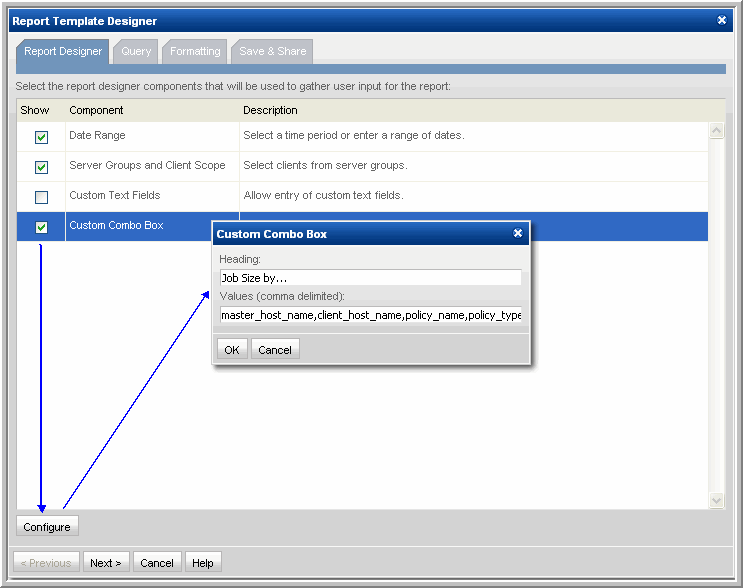
1. From the SQL Template Designer tabbed window, select Date Range and Host Groups and Client Scope and also Custom Combo Box.
2. Select Custom Combo Box and click Configure at the bottom of the Query window.
3. Enter the heading for the drop-down combo box—in this example, Job Size by...
4. Enter the following comma-separated list of values and then click OK: master_host_name, client_host_name, policy_name, policy_type_name, schedule_name, schedule_type_name, storage_unit_label
These will be the options that a user can select when generating a report.
5. Click on the Query tab and enter the following query:
SELECT to_char(start_date,'MM/DD/YY') run_date, to_char(${freeCombo}) unit, trunc(sum(kilobytes/1024/1024)) size_gb
FROM apt_v_nbu_job_detail
WHERE start_date BETWEEN ${startDate} AND ${endDate}
AND client_id in (${hosts})
GROUP BY to_char(start_date,'MM/DD/YY'), ${freeCombo}
6. Click Validate Query and then Next.
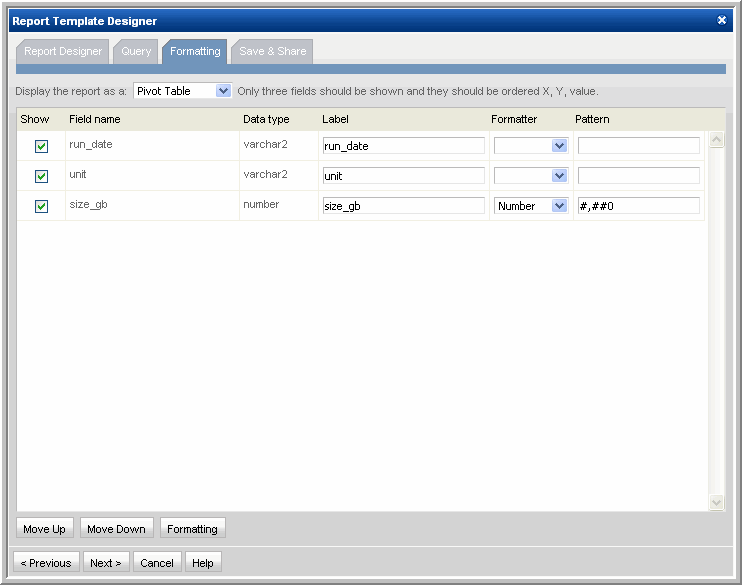
7. In the Formatting window, select Pivot Table and all three fields: run_date, unit, and size_gb
8. Save the report to a report menu group. Then, click on the saved report to generate it.


