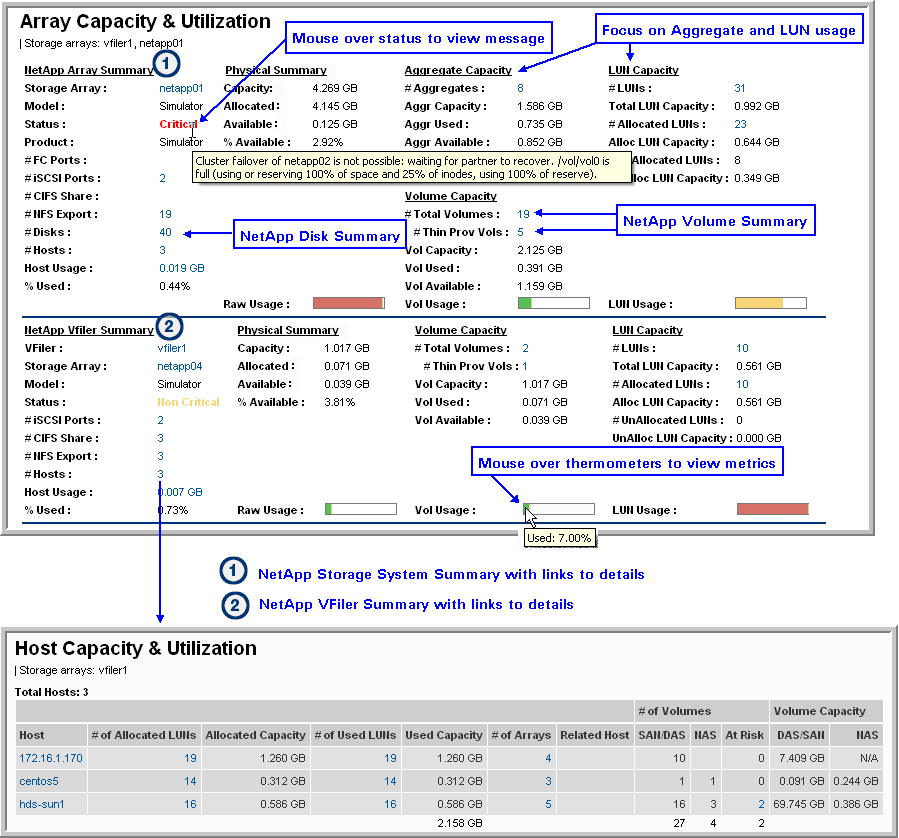

VFiler | The VFiler name |
Storage Array | The name that you assigned to the array. Available values include all supported storage devices. For a list of supported devices, see the Certified Configurations Guide. |
Model | The specific model of the NetApp storage. |
Status | The current status of the storage. Mouse over this status to view details. |
Product | The name of the product, typically shown as a series number. This field provides an indicator of capacity specifications, such as LUNs, hosts per array, and drives per array. |
# FC Ports | Number of Fibre Channel ports |
# iSCSI Ports | Links to
Array iSCSI Port Utilization. |
# CIFS Share | Links to
NetApp QTree Summary. |
# NFS Export | Links to
NetApp NFS Summary. |
# Disks | Links to
NetApp Disk Summary. |
# Hosts | The number of hosts that are sharing the capacity. This is the total number of unique hosts that have LUNs assigned by this storage array, and the hosts have been successfully queried using one or more host resource policies. If zero, host resources data has not been collected. |
Host Usage | Links to the
LUN Utilization Summary. |
% Used | Percentage of the NetApp storage already utilized. |
Capacity | Total raw capacity of the storage array. This value is the sum of all PDEVs (including spares—that is, drives that are not allocated to an Aggregate). If the RAID state of the PDEV is partner or broken, the disk is not included in the raw capacity calculation. You can set the capacity units to be displayed, either GB or MB, by selecting the Advanced option when you generate the report. |
Allocated | Allocated storage is physical storage consumed, including parity overhead and system overhead. A gap between raw and allocated capacity may indicate unused capacity, such as drives in a rack that are not in use. |
Available | Total raw capacity of the array that has not been allocated. The size is displayed in the units you selected with the Advanced option when you generated the report. |
% Available | Expressed as a percentage, total capacity of the LUNs in the array that have not been assigned to a host and that are available for provisioning. This percentage is a better capacity indicator than the number shown as Available Size. |
Raw Usage | Expressed as a percentage, total capacity that has been assigned to a host and that is not available for provisioning. |
# Aggregates | Links to the
NetApp Aggregate Summary. |
Aggr Capacity | The aggregate’s total size |
Aggr Used | Amount of the aggregate’s capacity that is in use |
Aggr Available | Available storage in the aggregate |
Aggr Usage | Used data storage at the physical layer. Mouse over the thermometer bar to view the % available. |
# Total Volumes | The number of volumes defined for this NetApp unit. Links to the
NetApp Snapshot Summary. |
# Thin Prov Vols | The number of thin provisioned volumes; Includes volumes where the Space Guarantee value equals “file” or “none.” |
Volume Capacity | Total capacity for all associated volumes |
Volume Used | Total of used space for all the associated volumes |
Volume Available | Available capacity from all of the associated volumes |
Volume Usage | Used data storage at the logical layer. Mouse over the thermometer bar to view the % available. |
# LUNs | The number of LUNs that have been created on the array. Click the Used link or the LUN link to go to the
LUN Utilization Summary. |
Total LUN Capacity | Total storage capacity for all of the associated LUNs |
# Allocated LUNs | The number of LUNs on the array that have been mapped to a host. These LUNs are typically configured as volumes on the host and dedicated to an application. For NetApp, these are the LUNs associated with an iGroup. Click on the Allocated LUNs link or the LUN link to go to the
LUN Utilization Summary. |
AllocLUN Capacity | The total storage capacity for the allocated LUNs |
# UnAllocated LUNs | The number of LUNs that have yet to be allocated |
UnAllocated LUN Capacity | The available LUN capacity |
LUN Usage | % of LUN capacity that is currently in use |