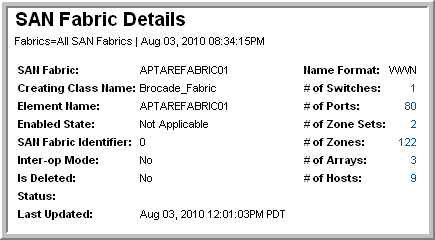

SAN Fabric | The name of the SAN Fabric |
Creating Class Name | The name of the class or subclass for this SAN Fabric |
Element Name | The name used to identify the SAN Fabric |
Enabled State | Denotes the state of the SAN Fabric as either enabled, disabled, or not applicable |
SAN Fabric Identifier | An administrative ID for the SAN Fabric |
Interop Mode | Indicates if the switch is operating in interoperability mode. For McData switches, this could be modes 2 or 3. |
Is Deleted | Indicates if the switch is offline or that a logical switch was deleted. |
Status | Indicates the current status of the SAN Fabric. |
Last Updated | The last time the database table was updated with the collected data |
Name Format | Identifies how the name of the SAN Fabric is generated. |
# of Switches | The number of switches in the SAN Fabric. Click the link to view the Switch Summary. |
# of Ports | The number of ports in the SAN Fabric.This is a string, not a numeric field. Clink the link to view the Port Summary. |
# of Zone Sets | The number of zone sets in the SAN Fabric. Click the link to view the Zone Set Summary. |
# of Zones | The number of zones in the SAN Fabric. Click the link to view the Zone Summary. |
# of Arrays | The number of arrays in the SAN Fabric. Click the link to view the Array Capacity and Utilization. |
# of Hosts | The number of hosts in the SAN Fabric. Click the link to view the Host Capacity and Utilization. |