Label | Description |
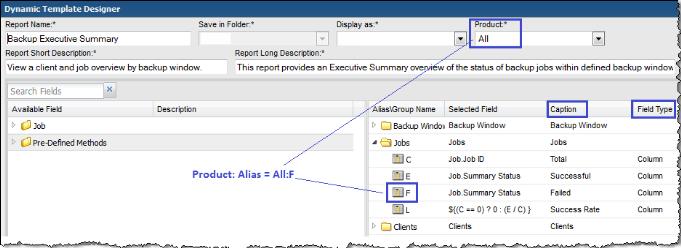
Field Label | Field Labels in Tables This is the text that will be displayed as a field label or a table column header in a tabular report. To replace the default caption with one customized for your reports, simply overwrite the default text. Field Labels in Charts The caption field becomes the x-axis label. For Line Charts, the label can be any object, such as a master server. When charting performance metrics for an object, a date field should be configured as a label. See Line Charts for Performance Metrics. |
Type: Display as Table | When the report template has the “Display as” component set to Table, the following Type options are available. • Hidden - Use this option when configuring a drilldown to another report template. The field will not be displayed in the report, but is required to access the necessary details to link to the sub-report template. There will be cases where the UI will automatically add hidden fields to the report template, to ensure satisfactory performance. • Column - Lists a column of values in a tabular report. • Checkbox - Include/exclude selectors to be displayed in a column in a tabular report. • Exclude - There will be cases when a field will be needed only for filtering purposes and you do not want this field to be included in the selected fields for the report. |
Type: Display as Bar Chart | When the report template has the “Display as” component set to Bar Chart, the following Type options are available. See also Configure a Bar Chart, Bar Chart Example, and Examples: Bar Chart Report Templates. • Caption - Define this field to be the x-axis values. • Bar - Configure the field to be represented as a bar and set its color.  • Line - Configure the field to be represented as a line and select the shape to denote its value in the line: rectangle, circle, diamond, or none. • % Line - Configure the field to be represented as a % line and select the shape to denote its value in the line: rectangle, circle, diamond, or none. • Legend - Define the labels and colors to be displayed in the bar chart’s legend. See Configure a Bar Chart to determine if you should use a dynamic or static bar chart type. • Hidden - Use this option when configuring a drilldown to another report template. The field will not be displayed in the report, but is required to access the necessary details to link to the sub-report. There will be cases where the UI will automatically add hidden fields to the report template, to ensure satisfactory performance. • % Bar - Define the field to be a % bar in the chart. • Exclude - There will be cases when a field will be needed only for filtering purposes and you do not want this field to be included in the selected fields for the template. |
Type: Display as Line Chart | When the report template has the “Display as” component set to Line Chart, the following Type options are available. See also Design a Line Chart, Line Charts for Performance Metrics, and Examples: Line Chart Report Templates. • Caption Field - This required field type supplies the category caption for the x-axis. Typically, a date field becomes the caption because line chart data is best represented over a time line. When you configure a date field as a caption, if the line field has an aggregation applied, the Group by Date setting must also be set to Yes. See also, Line Chart: Caption Field and Format Line Chart Fields. • Line Field - A numeric field can be configured as a line. One or more line fields can be included in a line chart report template. Select Line for the field type. See also, Line Chart: Line Field. In a “multiple objects per chart” scenario, a line represents a specific object, for example, an array. Line colors do not apply in this case. Colors will be determined dynamically by the system, since the number of objects represented by the lines is unknown until run time. See Multiple Objects Per Line Chart, One Metric Per Chart. In a “one object per chart” scenario, a line represents a metric for that object; for example, both used and available capacity could be lines in each array chart. See One Object Per Line Chart, One or More Metrics Per Chart. • Exclude - There will be cases when a field will be needed only for filtering purposes and you do not want this field to be included in the selected fields for the report template. For example, to filter on failed and partial backup jobs, you would drag in the job status field, make it an Exclude field type, and Configure a Static Filter. Note: Use the Add Group option to create folders when you need to group data fields that have disparate units of measure. This Group functionality is used in tabular reports to create spanning headers, but for line charts, it renders separate charts. For example, you might have a capacity value in KiB, but a performance value in Kbps. This requires two charts with different metric scales to plot the values. |
Type: Display as Pie Chart | When the report template has the “Display as” component set to Pie Chart, the following Type options are available. See also, Examples: Pie Chart Report Templates. • Caption - Enter the caption associated with the pie slice. • Pie - Configure the field to be a pie slice and set its color.  • Hidden - Use this option when configuring a drilldown to another report template. The field will not be displayed in the report, but is required to access the necessary details to link to the sub-report template. There will be cases where the UI will automatically add hidden fields to the report template, to ensure satisfactory performance. • Exclude - There may be cases when a field is needed only for filtering purposes and you do not want this field to be included in the selected fields for the report template. |
Formatter | The formatter list includes only values relevant for the field. For example, numeric attributes have only numeric formatters listed, such as Number, Currency, and File Size. See Valid Formatter Patterns. |
Formatter Pattern | Enter a specific pattern for the formatter to customize the default format. Example: KiB::GB or KB::_ |
Alignment | The default value provides the most common usage. For example, numeric values typically should be right-aligned so that decimal points line up. |
Wrap | Select Yes if you want long values/text to wrap in the space provided in the report. When No is selected, the data will extend horizontally. |
Total/Subtotal | Total/Subtotal Options: Null, Sum, Average, Minimum, Maximum. Use this configuration to aggregate the values, such as all the backup job sizes for a backup server. In its simplest form, this aggregation is used to display grand totals for all the data displayed in a tabular report. To enable subtotals for a set of fields: • Configure Total/Subtotal with a Null value and set Column Break to Yes for one or more fields in the report template. • Once you configure a subtotal, you can no longer create grand total rows at the end of the tabular report template. * Never configure Total/Subtotal and Column Break = Yes for the same field. |
Column Break | Column Break for Tabular Report Templates Select Yes if you want to list subtotals at the end of a group of related fields. Note that when you use subtotals, the sort order is automatically determined. All fields with a Column Break selection are sorted in the relevant ascending order and this sort order cannot be changed. Be sure not to remove or modify this sort order. Example: You could create a tabular report for client, server, and kilobytes. Then, you could subtotal on server to aggregate the kilobytes per server. * Never configure Total/Subtotal and Column Break = Yes for the same field. * Once you configure a subtotal, you can no longer create grand total rows at the end of the tabular report template. ---------------------------------------------------------------------------------------------------------- Column Break for Line Chart Report Templates For line charts, the column break is required if the selected object is potentially not unique. To ensure uniqueness, you may need to include a unique ID field with the Column Break set to Yes. For example, an array name may not be unique, however, the array ID is sure to be unique. Include both the name and ID in the template, but make the ID a hidden field with the Column Break set to Yes. See also, Field Configuration for One Object Per Line Chart. |
Drill Down to | Select the report to which this field will link. This takes you to the Drilldown Configuration window. See Drilldowns. For a list of out-of-the-box report templates that have drilldowns that you can use as examples, see Examples: Report Templates With Drilldowns. |
Drilldown Condition | A drilldown condition lets you control cases where a drilldown doesn’t make sense to be displayed, for example, null or 0 values for a field. For example, you wouldn’t want to drill down on a Job ID for a row if the value of Job ID returned from the database is Null or 0 (zero). Example: ${row['B'] != '0'} where B is the alias name In this example, the drilldown link will appear only when the returned value is not zero. Example: Configure a drilldown on field D and enter a drilldown condition as shown in the following example. In this example, if the row where the value of the field aliased as A is NULL, the value in column D will not have a drilldown URL enabled. ${row[‘A’] != ''} Example: Multiple conditions can be configured. ${row[‘C'] != '' && row['E'] == ''} |
Style | Use this option to configure the background color of a cell in a tabular report. Example: ${row['C'].data == 'Partial' ? 'yellowBackground' : row['C'].data == 'Failed' ? 'redBackground' : '' } where C is the alias of the selected field. |
Group by Date | This is applicable only for Date fields in Bar, Line, and Pie Chart report templates to aggregate data for charting. If only one date field is specified, it is used as the default for the Group by Date configuration. If you configure a date field as a caption, Group by Date is automatically set to Yes if an aggregation function has been applied to the line or bar fields. If there are multiple date fields in a template, you must choose only one for this setting. This Group by Date setting identifies the field that the scope selector will use with the Group By scope component. When this Group by Date element is set to Yes, the Group By component in the Scope Selector is automatically selected. |
Graphics Tool Tip | Enter a description to be displayed when a user hovers the mouse over an image in a report; for example, use this setting to enable mouse-overs on lines in bar charts, lines in line charts, and even images in table columns. Example: Available: ${row['Q1']} where Q1 is the alias name. |
Comma-delimited ID Name Formatter | For text fields only. Use this option if data returned for a field has multiple values that need to be separated by commas. Only the names will be shown in the rendered report and the IDs will be used for drilldowns, if drilldowns are configured. |
Tool Tip | This is the description supplied by the Data Dictionary for this field. You can overwrite or supplement this text. This description will be displayed when a user hovers the mouse over the field or table column label in a report. It will also be incorporated into the context-sensitive help that is displayed from the Help button. See Quick Start Step 6: Generate a Report and View the Automatically Generated Help. |
Formatter Name | Data Type | Valid Patterns | Description |
Date | Date | N/A | Date formats are derived from the user's profile. |
Date+TimeZone | Date | N/A | Date formats are derived from the user's profile. |
Date Group By | Date | N/A | Used in charts and graphs to format the legend, based on the “group by” that is selected in the scope selector at run time. This formatter determines the optimum date format for that group by. |
Time Elapsed | Number | (SEC)|(MIN)|(HR)|(DAY) | Displays time in a more readable format, converting minutes to hours, where relevant. For example, 120 min would be displayed as 2 hrs. |
Time Duration | Number | N/A | Formats a time value that is in milliseconds to the following format: hh:mm:ss Applicable only for fields that denote time duration; for example: finish_date minus start_date |
Cron Schedule | Number Varchar2 | N/A | Presents a standard cron expression in a user-readable form. For example, */30**** will display as “Every 30 minutes.” |
Numeric | Number | N/A | Format derived from the user’s profile. |
Decimal | Number | % converts to % format Otherwise, leave as null. | Formats the value with the number of decimal places specified in the user’s profile; can also be used for percentages. |
Speed | Number | N/A | Formats speed values. N/A if speed = 0. |
Currency | Number | N/A | Format derived from the user’s profile. |
File Size | Number | (KiB)|(MiB)|(GiB) is the input data type | Formats the file size unit of measure to what is most applicable to the selected field value. For example, 2048 MB would become 2 GB |
File Size No Label | Number | Units::Units | For APTARE StorageConsole Backup Manager only. Formats the file size to the most relevant unit of measure, but omits the unit label. Applicable for byte size data. |
Unit Converter | Number | KB::TB KB::_ (for dynamic output) | Determines the value to be used when converting from one unit to another, for example, from KB to GB. The “division by” value is determined from the user’s profile settings, either 1000 or 1024. Note that for line charts, if you select Unit Converter for a line, it only formats the mouse-over, not the Y-axis label. |
Char Substitute | Number Varchar2 Date | <value_to_replace>::<replacement_value> | Replaces specified characters in a string value. For example, if the database returns "Host1, Host2" this formatter would be replaced the "," with "<br/>" |
Null Substitute | Number Varchar2 Date | <string> | Replaces null values with a user-supplied string. |
Percentage | Number | number1:number2:number3 Data values from 0 to number1 will render Green color in the percentage bar. Values between number1 and number2 will render Yellow color and values between number2 and 100 will render Red color. The values number1 and number2 should always be between 0 and 100. The number3 parameter determines the size of the % bar in pixels. | Display a % bar (thermometer) in a chart. |
Full Name | Number | N/A | For File Analytics only. Converts a shortcut name to a full name for NetApp, CIFS, and WinFS. |
Yes/No | Varchar2 | N/A | Translates Y/N to Yes/No. |
Status Icon | Varchar2 Number | Example: 0|Green,2|Red,1|Yellow,*|White If the value = 0, the circle icon will render in green. | Displays status icons depending on the data, which could render in red, yellow, blue, green and white. |
Report Template | Report Type | Product: Alias | Caption | Field Type |
Backup Manager Reports | ||||
Job Status Summary | Bar | All: T | Failure | Bar |
All: R | Success | Bar | ||
All: S | Warning | Bar | ||
Job Summary | Table | EMC Avamar: M | Error Code | Column |
All: K | Exit Code | Column | ||
Symantec NetBackup: P | Exit Code | Column | ||
Job Volume Summary | Bar | All: D | # of Files Backed Up or Restored | Line |
All: B | # of Jobs | Hidden | ||
All: C | Backup/Restore Volume | Bar | ||
Job Duration | Bar | All: F | Job Duration | Bar |
Capacity Manager Reports | ||||
Array Executive Summary | Table | All: J | Used | Column |
NetApp Aggregate Summary | Table | NetApp: R | Usage | Column |
NetApp Volume Summary | Table | NetApp: K | Usage | Column |
NetApp Cluster-Mode Summary | Table | NetApp Cluster-Mode: H1 | Usage | Column |
Hitachi DP Pool Summary | Table | Hitachi Data Systems: H | Used | Column |
EMC VNX (Celerra) Storage Pools Summary | Table | EMC VNX (Celerra): C1 | Used | Column |
EMC VNX (Celerra) Volume Summary | Table | EMC VNX (Celerra): B1 | Usage | Column |
Hitachi NAS Storage Pool Summary | Table | Hitachi NAS: P | Usage | Column |
EMC Isilon CPU Performance by Cluster | Line | EMC Isilon: B | Max CPU % | Line |
EMC Isilon CPU Performance by Node | Line | EMC Isilon: G | Avg CPU % | Line |
NetApp Cluster-Mode Disk Performance by Cluster | Line | NetApp Cluster-Mode: C | Disk Busy % | Line |