Portal Overview
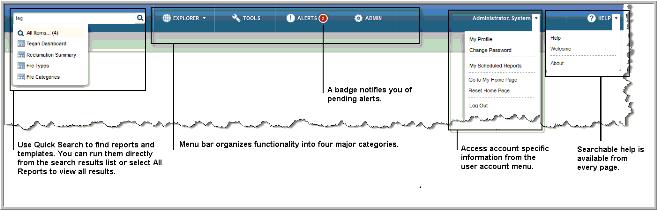
Understanding Portal terminology is a prerequisite for understanding the functionality. The following figure highlights naming conventions for each area in the interface.
Figure 2.1 Portal Naming Conventions
The StorageConsole Portal is organized into the following major sections, accessed from the top of your browser window. Refer to the
Major Areas in the Portal figure, along with the following descriptions.
• Explorer - This management page is a window into your reporting inventory, allowing you to browse through and manage StorageConsole templates, reports and dashboards. From here you can view mappings between reports and templates, if sharing is enabled, detailed report descriptions and other information. On the management side, you can create, edit, and delete reports, plus organize them into a folder structure that is relevant to your business. See also,
About the Explorer and
Templates, Reports, and Dashboards Overview. • Tools - The Tools page provides access to designers that enable custom report template creation: the Dynamic Template Designer; the SQL Template Designer, an advanced feature, requiring experience in SQL (Structured Query Language) development; and the Methods Designer to create special processing methods to be included in report templates created with the Dynamic Template Designer. The Tools list also provides access to the File List Exporter (if you have licensed the File Analytics product). The exporter assembles file analytics metadata into a comma-separated values (.csv) file, and allows you to export for further analysis.
• Alerts - The Alerts page provides access to system notifications with the ability to view and suppress them.
• Admin - This page provides consolidated access to functions that allow administrators to manage the Portal, create users, groups, set up data collection, plus set privileges for report and feature access.
• Quick Search - Use
Quick search to find and run a template, report or a dashboard by name. Search is case insensitive, supports partial entries, and will display a list of potential matches using a string match. If the Cloud is enabled, search results will also include report templates available from the cloud. Because you can directly run a report from your
Quick search results, this enables you to preview any cloud template before you save it locally. Results are displayed in a full search page that allows you to filter results further or start a new search. See
Templates, Reports, and Dashboards Overview.
• User Account Menu - This drop-down menu provides convenient access to account-specific features such as managing your profile information, your homepage, and access to your scheduled reports.
• Help - Displays context sensitive help for the page. This menu also displays the software version (About) and provides access to the Welcome page. The Welcome page provides up-to-date information about trade shows, releases, new features and newly available cloud report templates.
Visit our YouTube channel to view demonstration videos featuring specific areas of the product:
http://www.youtube.com/user/APTAREIncFigure 2.2 Major Areas in the Portal
Browser Tab Basics
Navigating in the Portal is made easy through the use of tabs to display functionality with templates and reports simultaneously. As the number of open tabs increases, you can always quickly navigate to management pages, such as the Explorer, Admin or Tools, by clicking the relevant category on the menu bar.
There are a few basic navigation features that are important to know:
Scrolling through tabs - As the number of opened tabs increases, a scrolling icon is displayed on either side of the page. This icon allows you to move quickly through your open tabs, even if they are not visible on the page.
Viewing all tabs - If you’ve opened more tabs than will fit in the window, use the tab list to view and navigate through all open tabs.
Changing the tabs order - To move a tab to a different place on the tab strip, drag it using your mouse. While you’re dragging a small indicator shows where the tab will land.
Show tab list - As many tabs are opened, the browser will become filled with tabs and some will not be visible on the page. At this point, an arrow at the far right of the tabs enables a selection of the full list of open tabs.
New Dashboard - A tab with a plus icon is always displayed to create a new dashboard, as required.
Closing one or all tabs - You can close all tabs at once, close a single active tab, or close all tabs but the active one by right-clicking directly on top of a tab.
Figure 2.3 Tab Navigation Basics