About the Explorer
The Explorer is a management window for your reporting inventory that allows you to browse and manage StorageConsole templates, reports and dashboards, as well as your own custom reports. This view provides a number of visual prompts, enabling you to quickly determine report types, their state, and location—whether it’s local or in the cloud.
Visit our YouTube channel to view demonstration videos featuring specific areas of the product:
http://www.youtube.com/user/APTAREIncSections in the Explorer Navigation Panel
The
Explorer window is divided into sections:
• Home - Contains folders for reports you’ve shared with other users and user groups, folders you’ve created, and the StorageConsole report template inventory. User folders are displayed in blue. System folders are yellow.
• Shared with Me - Contains a list of reports and templates that other users have shared with you. As the report/folder reader, you are limited in the actions you can perform on the report or folder. Shared reports can be emailed, exported or alerted on. You cannot edit or delete shared reports or folders.
• Cloud - Contains cloud-based report templates. APTARE periodically publishes new or updated report templates and makes them available through the cloud. If this privilege has been enabled for your Portal account, you can access, run and save these as they become available through this section in the
Explorer. Proxy connections are supported for Cloud reports. For information about configuring your settings, see
Configure Proxy Server.
• Recent - Displays a list of the 20 most recently run, scheduled in a background run, or modified reports within the last 30 days as limited by your login. Note - if a report has been run and then your access to the report changes, for example through revoked sharing, that report is not displayed in the recent list.
Working in the Explorer View Panel
The Explorer view panel allows you to browse, view, run and manage StorageConsole Out-of-the-Box report templates, as well as your own custom reports. You can quickly access this area no matter how many tabs are open, by clicking the Explorer menu. This instantly activates the Explorer window.
This area provides a single, consolidated view of your inventory with relevant details and the ability to navigate to originating files. As you manage templates and reports, it’s important to understand how they are related to other reports and how they are shared with other users. You can quickly assess this information from the
Explorer view panel. Refer to
Portal Naming Conventions.
About the Action Bar
In the Explorer, the element you select, such as a folder, a report, a template, or a shortcut, determines what operations are available. For example, a report can be deleted, renamed and shared. A system report template cannot. To make this easier, the Action bar changes when an element is selected, showing you what operations are available based on your selection. Operations are also available through a right-click menu.
Customizing Your View Panel
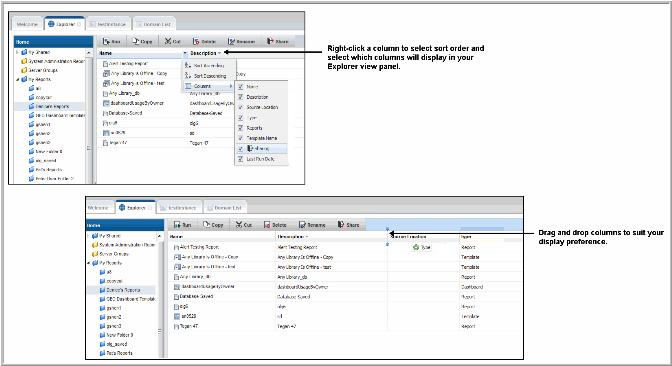
The Explorer view panel displays multiple columns of information about reports, dashboards and templates. You can choose:
• Which columns are displayed
• Sort order within the column
• Display order of entire columns
You can also choose to show or hide the Details of a report. Some reports contain long descriptions that can be shown by clicking the Details button. This displays a panel under the inventory list and if available, when a report is selected, displays additional information about the report.
NOTE: Changes made to any view panel impacts all views within that tab. These preferences are session-based and are not retained once you log out.
Figure 2.4 Customizing the Explorer View Panel
Folder Types
In the
Explorer, there are two folder types: system and user. The folders operate similarly, but the functions available to each type differ. System folders are static and you cannot modify them. User folders can be created, modified, deleted, and shared. System folders are shown in yellow and user folders are in blue. As you select a folder, the available functions are displayed on the action bar.
Figure 2.5 Folder Types and Operations
Icons
Icons are used to represent report template types. You can quickly determine if a report will be produced as a dashboard, table, pie chart or column chart by the icons and roll-over help. These icons may display a badge to convey additional information. For example, shortcuts can be distinguished from the original file by the arrow that appears on the icon. This allows you to quickly scan lists of reports and make business decisions based on visual indicators.