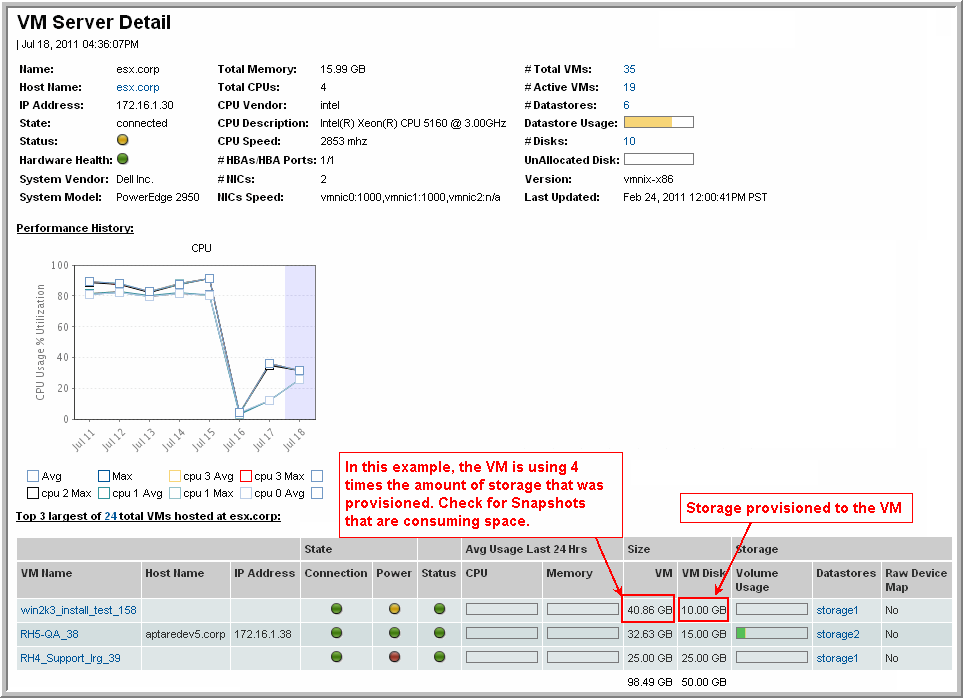


Name | Name of the VM Server that is hosting the virtual server; for example, the ESX host |
Host Name | Hostname of the guest; value is displayed only if VMTools is installed; links to Host Details |
IP Address | IP address of the Virtual Machine; value is displayed only if VMTools is installed |
State | Network adapter connection state: Connected, Not Responding, Disconnected, None |
Status | Gray=Status Unknown, Green=Normal, Yellow=Warning, Red=Alert, a definite problem |
Hardware Health | Indicates the overall health of the host’s hardware: None, Unknown, Green=Normal, Yellow=Warning, Red=Alert |
System Vendor | Host vendor |
System Model | Model of the host system |
Total Memory | Total memory available as a resource to the VMs on this host |
Total CPU | Total CPU available as a resource to the VMs on this host |
CPU Vendor | Processor’s vendor |
CPU Description | Type of processor |
CPU Speed | Processor speed |
# HBAs/Ports | Number of host bus adapters and ports on the VM Server |
# NICs | Number of physical network interface cards |
NIC Speed | Speed of the interface cards |
# Total VMs | Number of VMs configured on this host and in the inventory |
# Active VMs | A VM is active when it is in the inventory and powered on; it is inactive if it is in the inventory, but powered off. |
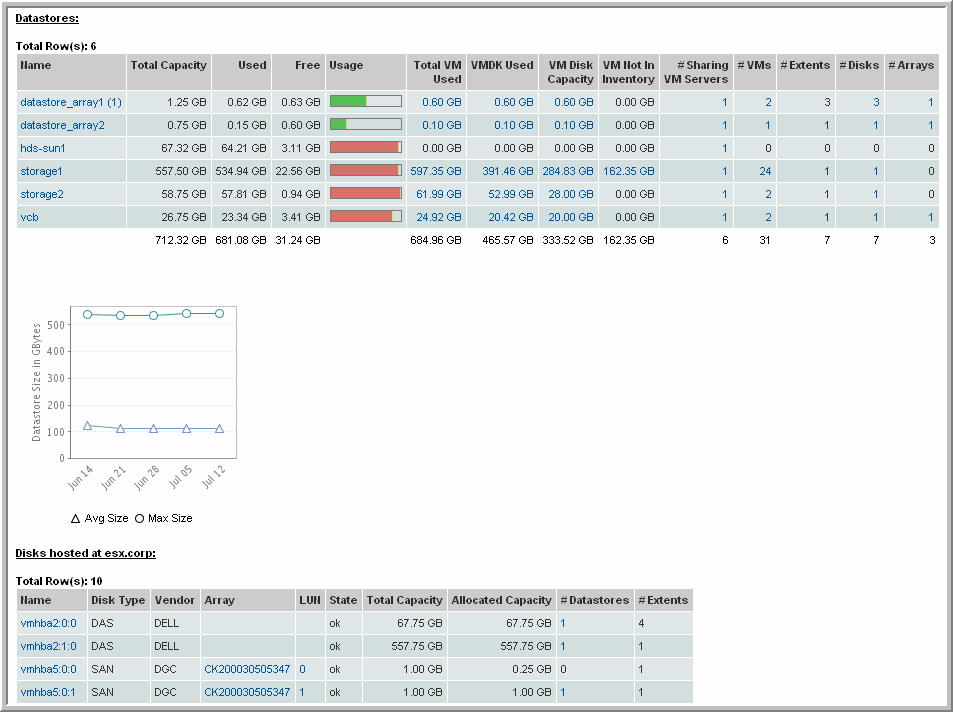
# Datastores | Number of datastores that this VM Server is using |
Datastore Usage | Amount of storage in the datastore that this VM Server is using |
# Disks | The number of disks that the VM Server can access, either internal disks or LUNs. Drill down to the Datastore Utilization Summary. |
Unallocated Disk | Mouse over the thermometer bar to view the total disk capacity, the amount used, and the % of the total used. Drill down to the Datastore Utilization Summary. |
Version | Version of the virtual server software, such as ESX |
Last Updated | Timestamp of last data collection |
CPU | Average and Maximum usage graphed over time for the number of samples taken within that time frame. |

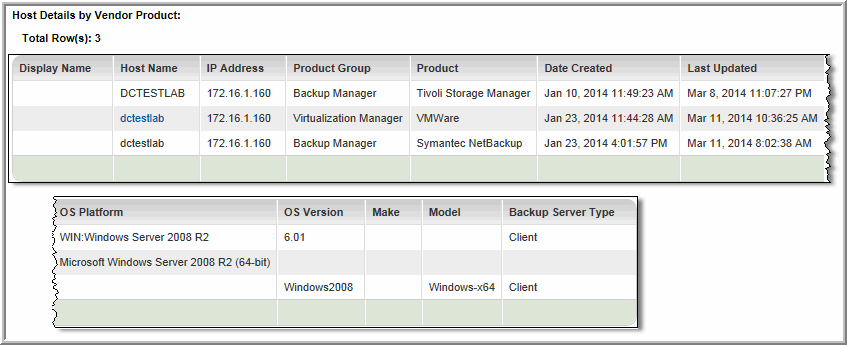
Display Name | Name that is displayed in reports. |
Host Name | Name of the host as it was collected by the vendor product. |
IP Address | IP address of the host. |
Product Group | The APTARE StorageConsole group, such as Capacity Manager, for which the host data was collected. |
Product | A specific vendor product (subsystem) from which host data was collected; for example, VMware. |
Date Created | The date and time the host was created in the StorageConsole database. |
Last Updated | The date and time the host data was updated in the StorageConsole database. |
OS Platform | Operating system of the host, as collected from this vendor product; for example, Windows Server 2008 R2. |
OS Version | The host’s specific operating system version, as collected from this vendor product; for example, 6.01. |
Make | The host’s make, as collected from this vendor product; for example,Windows-x64. |
Model | The host’s model, as collected from this vendor product; for example, PowerEdge 2950. |
Backup Server Type | The host’s role in a backup relationship, client or server. |