Format the SQL Template Output
1. Format fields in a report within the Formatting tab.
• Check the query fields to select the fields to be displayed in the report.
• Move fields up and down to position them in the report’s output.
• Modify the Label for the displayed fields to something more relevant to your needs.
2. Choose a Report Type:
Number, Size, Date, and Time Formatting
The following field formatters are provided:
• Custom Number: This format is based on the Java class
NumberFormat. Unlike the Number formatter, this Custom Number formatter takes into account the Pattern when formatting the value. See also,
Negative Value Formatting Examples.
• Decimal: This formatter is based on Java decimal formatters,
DecimalFormat.
• Date: This formatter is based on the Java class
SimpleDateFormat. Note that the Date Formatter is available for templates developed in earlier IT Analytics releases, however, it is no longer supported in the SQL Template Designer because the format of the date is controlled by the user’s profile. For special cases, where custom date formatting is required, use the Oracle TO_CHAR function in the query. This function converts a date or interval value to a character data type in the specified format: Date, Timestamp.
• File Size: This formatter formats the file size with the unit of measure that is most applicable to the field value. For example, 2048 MB would become 2 GB. The pattern field takes the following values: Bytes, KB, MB, GB, and TB (or the Kibibyte multiples: KiB, MiB, GiB, and TiB). This is the unit of the data returned from the Portal database.
• Percentage Bar: The Percentage formatter results in a horizontal bar, representing the value in a tabular report column. For example, 50:75 results in a color designation, where a value < 50 renders green, 50-75 renders yellow, and > 75 renders red.
• Status Icon: Colored icons, relevant to a value, will render in a tabular report column. See
Status Icon Values.
• Truncate: Truncates a string with ellipsis. The maximum size of the string is 28 characters. Use the pattern to override the maximum size. When using the Truncate formatter, it is recommended to use the Advanced dialog to create a hover tool tip. See
Creating Mouse-over Hovers.
Negative Value Formatting Examples
Since the number format is based on Java formatters, you can use a semi-colon (;) sub-pattern boundary to represent negative numbers so that they stand out differently from positive values.
The following examples show how to use the semi-colon to represent the negative value, -1234.56.
• #,##0.00;(#,##0.00) displays the value, -1234.56, as (1,234.56)
• #,##0.00;'<font color=red>'(#,##0.00) displays the value, -1234.56, in red as (1,234.56)
Status Icon Values
Use the following values for a status icon in a tabular report.
Value | Icon |
red | |
yellow | |
white | |
blue | |
green | |
error | |
warning | |
success | |
fast | |
medium | |
slow | |
status0 | |
status1 | |
status2 | |
status3 | |
status4 | |
status5 | |
status6 | |
status7 | |
status8 | |
status9 | |
status10 | |
status11 | |
status12 | |
status13 | |
status14 | |
status15 | |
trend_down | |
trend_flat | |
trend_up | |
unknown | |
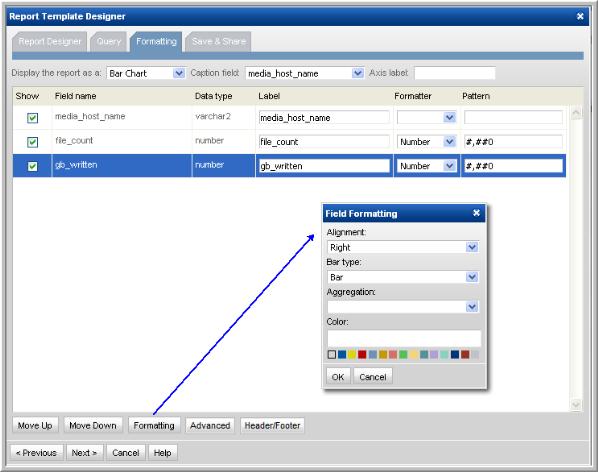
Alignment, Aggregation, Bar Type, and Bar Type Color
Select the Field and click Formatting (at the bottom of the window) to view the formatting options.
• Data alignment - Left, Center, or Right.
• Aggregation - Sum, Average, Minimum, Maximum
• Bar type - Bar or Line (for bar charts only)
• Color - Bar or Line (for bar charts only)
1. At the bottom of the Formatting window, use the Move Up and Move Down buttons to organize the fields in the order that you want them to appear in a tabular report. Be sure to select a row before shifting the fields.
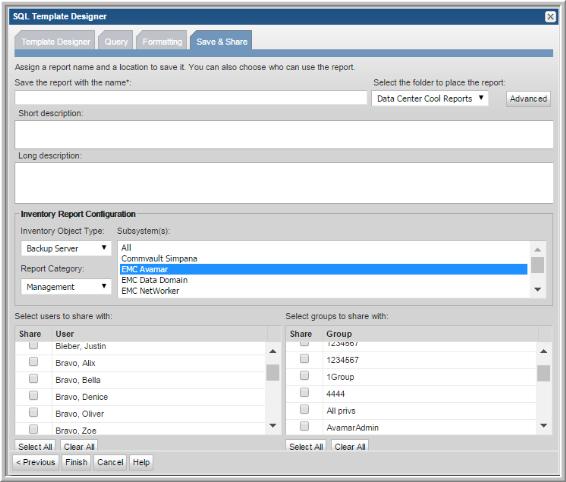
2. In the
Save & Share window, complete the appropriate text boxes to save and share the report, then click
OK. You can choose to share with one or more users and user groups. See
Save and Share Report Templates. You can also assign report configurations for the
Inventory. This determines how the report templates will be classified and displayed in the
Inventory. See
Inventory Report Configuration The saved report template will be listed in the report group that you select.
Configuring a Header and Footer in a Custom Report Template
At the bottom of the Formatting window in the SQL Template Designer, click the Header/Footer button to launch the window where you can define the text and variables that will be displayed when the report is generated.
Any variables used in the query can be included in a header or footer, as shown in the above example.
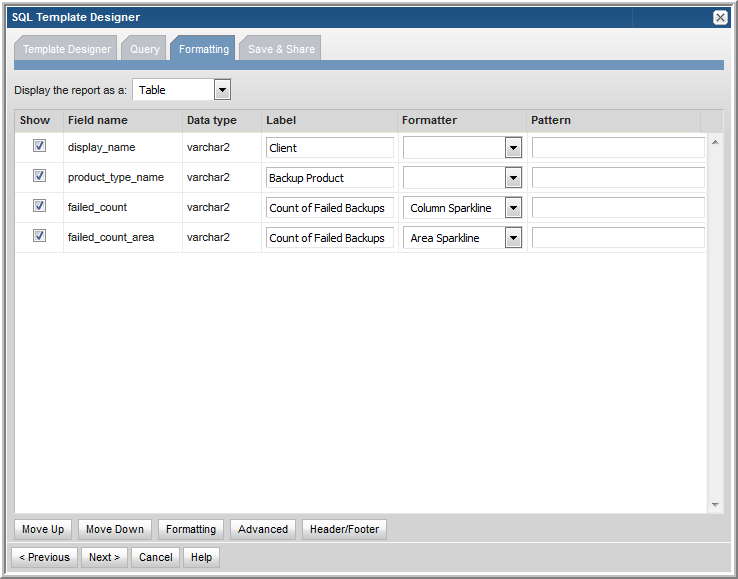
Area, Line or Column Sparkline Format for a SQL Tabular Report Template
Sparklines render as small charts embedded in each row of a tabular report, presenting an at-a-glance visualization of data trends. You can display a number series as an Area Sparkline, Line Sparkline, or a Column Sparkline in a column of a tabular report to illustrate spikes in data that may indicate issues that require attention. For details on how to configure a sparkline in a SQL Template, see
Example of a Sparkline Query in a SQL Template. This section covers only the SQL Template formatting selections required to render the data as a sparkline.
To format a table column as a sparkline chart, take the following steps.
1. In the SQL Template Designer Formatting tabbed section, select the field to be rendered as a sparkline chart.
2. From the Formatter list, select either Column Sparkline, Line Sparkline, or Area Sparkline.