Dynamic Template Designer Quick Start
A basic use case simply can be to list values for various entities of an enterprise object. For example, list the allocated and available capacity of arrays. This is best represented in a tabular report.
The following quick-start example requires the following tasks to create a tabular report:
Quick Start Step 1: Create a Basic Table Dynamic Template
2. Enter or select the mandatory/optional fields shown at the top of the window and save the report template. Category refers to grouping assignment within the Inventory. When displayed in the Inventory, templates are sorted into information categories such as performance, storage or forecasting. If a category has not been selected, these templates are displayed under the heading Uncategorized. You can always assign a category, by customizing an existing template.
• A dynamic template categorized for an object type and All products are displayed for all groups and individual servers of this object type.
• A dynamic template categorized for an object type and specific products are only displayed for groups and individual servers of this object type, subsystem and not others.
This step alone can produce a very basic report.
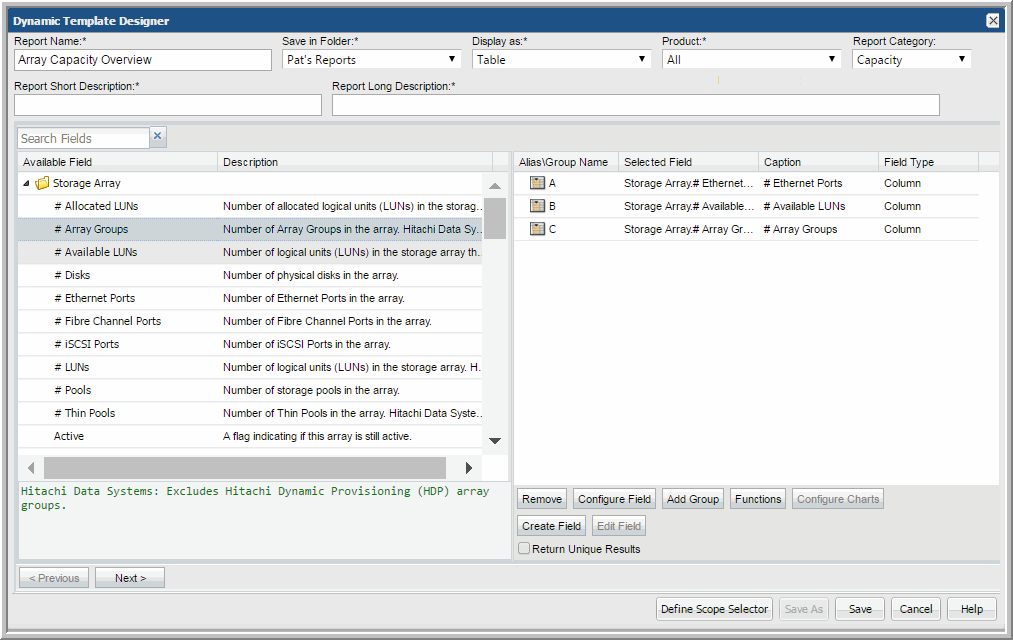
3. Click Save to save this initial version of the report template.
This example produces a report similar to the following:
As you can see, these results would benefit from additional formatting, hyperlinks to other reports, totals at the bottom of the numeric columns, and perhaps even additional table columns with values calculated from other fields. For example, totals would be useful at the bottom of the table and perhaps an additional column with calculated values would improve this report.
Basic formatting will be covered in this example, however, additional details can be found in:
Quick Start Step 2: Format Fields
1. Double-click a numeric field. For this example, we’ll double-click the column that has the Capacity label.
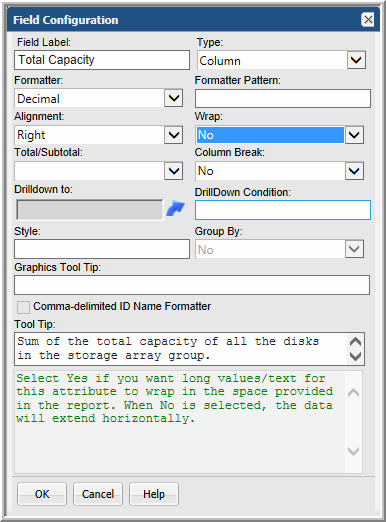
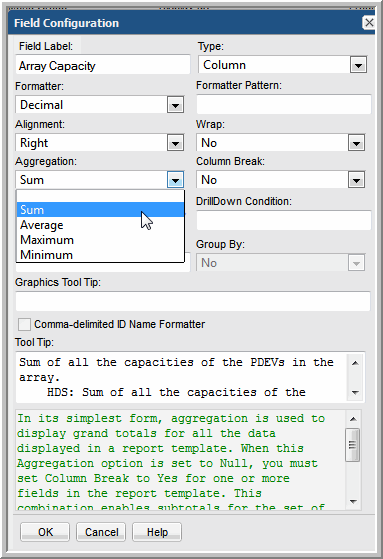
• Change the Caption from Capacity to Array Capacity.
• For the Formatter, select Decimal and make sure the Formatter Pattern is blank.
Later, you may want to configure this field to get a total of the capacity of all the arrays in the report.
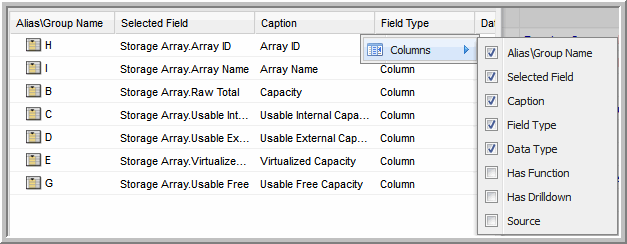
2. Tip: If you don’t know if a field is numeric, hover over a header in the Selected Field panel to view the list of columns to select. For this example, select Data Type.
Quick Start Step 3: Create a Calculated Field
For this example, it would be useful to have a Total Usable column, derived from fields we have already included in the template. The calculation for total usable capacity will be defined as:
Usable Internal + Usable External - Virtualized Capacity = Total Usable Capacity
1. Click Create Field at the bottom of the Dynamic Template Designer window.
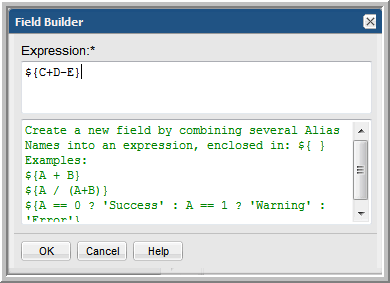
2. In the Expression box, enter the calculation for total usable capacity: ${C+D-E}
Note that all expressions need to be enclosed in braces, with the following format: ${}
3. Click OK to launch the Field Configuration window where you can configure a Caption that will display Total Usable in the rendered report.
Quick Start Step 4: Configure Table Column Totals
1. Double-click a capacity field, such as Array Capacity.
2. In the Field Configuration window, select Sum from the Total/Subtotal drop-down list.
3. Click OK.
4. Repeat these steps for any numeric column where you want to see a total at the bottom of the tabular report.
Quick Start Step 5: Define the Scope Selector
This set of steps lets you select items that will appear in the Scope Selector when the report is run.
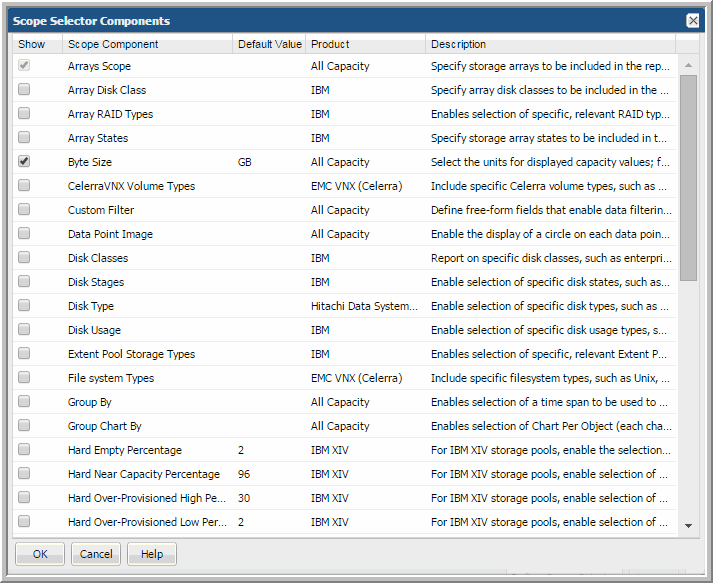
1. At the bottom of the Dynamic Template Designer window, click Define Scope Selector.
Scope selectors are specific to an enterprise object.
Figure 8.1 Scope Selector Components for an Array Enterprise Object
Note that some entries may be already selected and cannot be deselected. This is because those scope elements are required for the selected enterprise object.
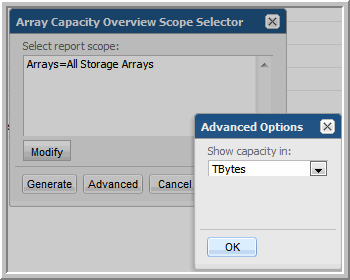
In this example, we’ve selected Byte Size. This lets the user select the units in the Advanced Options of the Scope Selector, as shown in the following screen.
Quick Start Step 6: Generate a Report and View the Automatically Generated Help
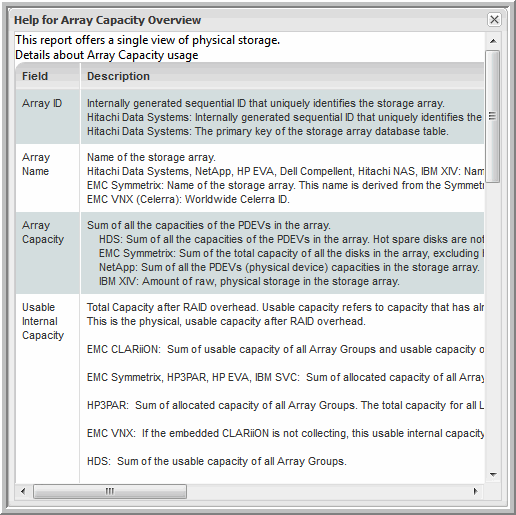
APTARE IT Analytics relies on an underlying data dictionary that contains detailed descriptions of not only enterprise objects, but also the characteristics of those objects. When you create a report template, the help is automatically derived from the data dictionary.
1. Use Search at the top of the window and enter the name of the report template: Array Capacity Overview.
2. Select the report template from the search results and the report will render.
3. Click
Help at the top right of the APTARE IT Analytics window. The auto-generated help window appears.
