Monitoring Data Collection Status
Use the Collection Status page to monitor the health and progress of data collection. This view also contains probe runs and can be organized to suit your business requirements providing essential details that enable you to diagnose collection issues. Collection status, available at the data collector and policy level, provides results for the last time collection was attempted for enabled probes.
Organizing the Collection Status View
Customize the view into your Collection Status by grouping the information in a way that is the most relevant to your business. This allows you to see what you need, when you need it, so you can efficiently analyze the data.
By default, the grid displays information for the last set of collection runs and organizes it by probe.
Use the
Advanced Filter to build a more granular level of filtering on the viewing grid. You can create queries using all relevant fields in the database with specific operators to further refine and locate the information you need. See
Advanced Filtering for details.
Note: When accessing the Collection Status view by drilling down from a status on the Collectors view, the information is already filtered based on your original selection. That is, if you drill down from a policy status, the view is filtered by the associated policy. You must Clear the Filter to view the entire set of information.
Quick Filters
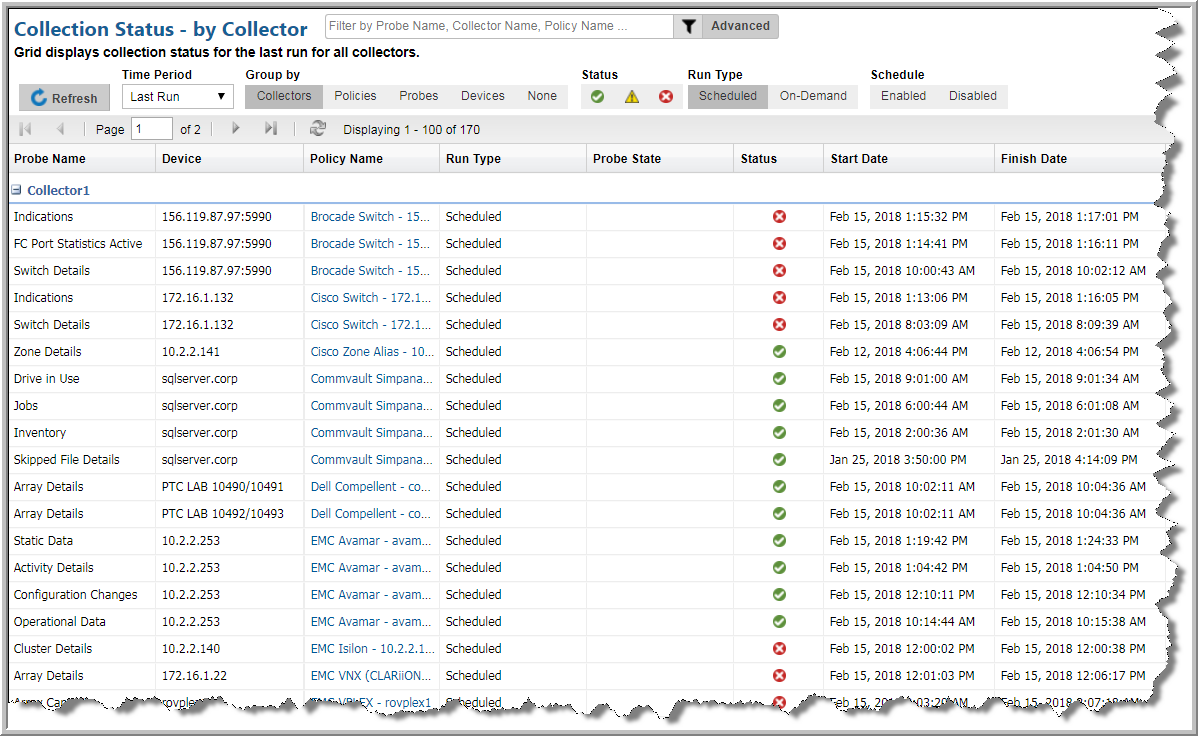
Use Quick Filters to sort the collection status without building a query with the Advanced Filter. Choose from:
• Time Period - Select the data collection run time period. You can select the Last Run (the default) or a value of last days, from 2 to 7. For example, you can view all the data collection status information for the Last 4 days.
• Group by - Select how the data collection status information is grouped. You can choose from: Probes, Policies, Collectors, Devices or None. If None is selected, the grouping is by Probe Name.
• Status - Select to filter data collection information by Status. Choose from Success, Warning or Failure. Click the status icon in the grid to display details.
• Run Type - Select to display status information based on the type of collection run. Choose from a Scheduled or On-Demand run. All collection run types are shown by default. Note, On-Demand runs are not available for all vendors.
• Schedule - Select to include data collection status information for those probes, policies and collectors that have schedules Enabled or Disabled.
Viewing Data Collection Status
Collection status, available at the data collector, policy and probe level, provides results for the last time collection was attempted. Collection is schedule-based and can also be run on-demand for certain vendors. When policies are created, a schedule is set, but collection may not enabled. Because the status is relevant to the conditions you are troubleshooting, you can view a status if the schedule is enabled or disabled.
To View Data Collection Status
1. Navigate to Admin>Data Collection>Collection Status. By default, the grid is organized by Probe Name.
2. Organize the grid to your preference. You can use
Quick Filters to efficiently sort the data with pre-defined options, or use the
Advanced Filter
to build a more granular query. See
Organizing the Collection Status View.
3. Evaluate the collection Status. Click the status icon to display details.
• Success - Data collection has successfully completed. The last run of each probe in a policy, including an On-Demand run is successful.
• Warning - Data collection has completed with some errors. The last run of each probe in a policy, including an On-Demand run is complete and any probe is:
• Successful and there are error messages in the collector log
• Canceled or skipped. If an On-Demand collection is running, the scheduled run is skipped.
• Failure - Data collection has failed to complete. The last run of each probe in a policy, including an On-Demand run is complete and any probe is:
• Interrupted which indicates that collection was running and stopped during the run. For example, when services are stopped or the receiver monitor thread detects that a Collector is not running, any On-Demand Runs or Scheduled collections In Progress are marked as Interrupted. For scheduled runs, restarting the services, marks the previous In Progress collection as Interrupted as well. For On-Demand runs, restarting the services, results in the On-Demand run starting again.
• Canceled with an error for any probe in the policy (only applicable for On-Demand runs)
• Canceled with success for any probe in the policy and fatal error messages in the collector log (only applicable for On-Demand runs)
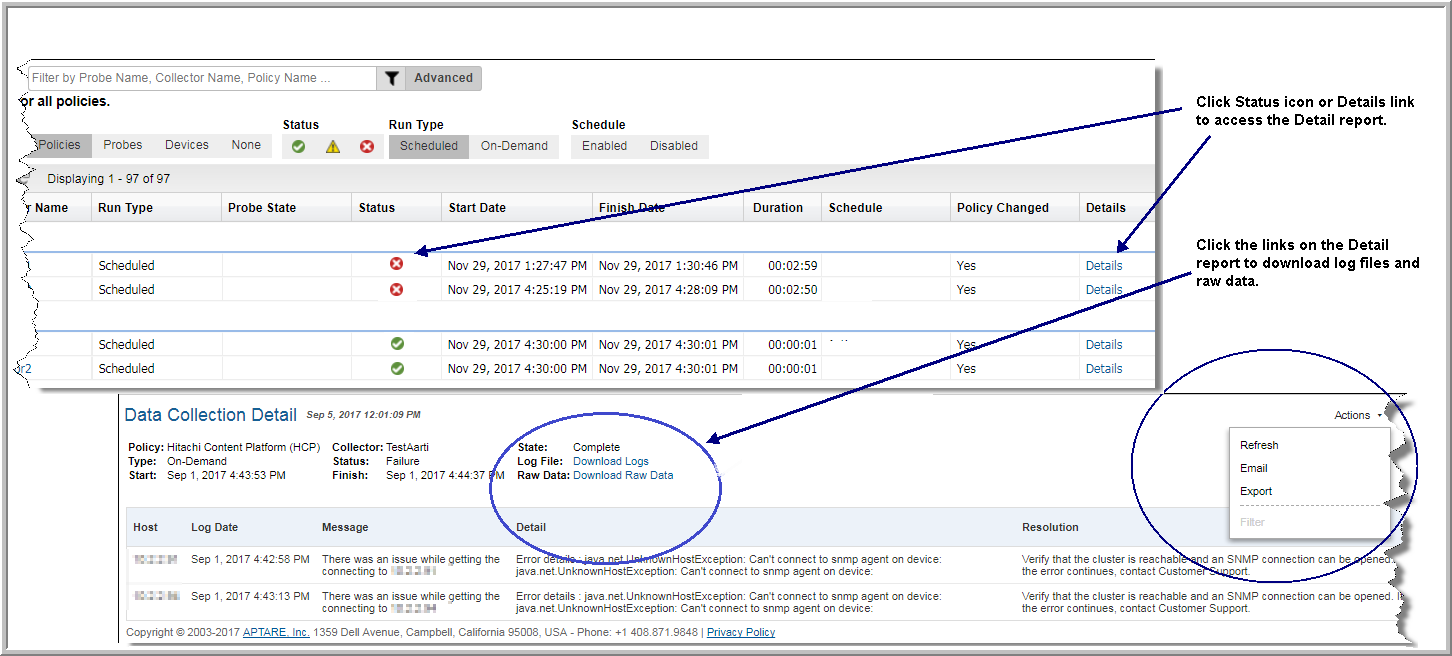
Troubleshooting Data Collection Status
Troubleshoot issues by drilling into the
Data Collection Detail report. This detail report can also be displayed by clicking the
Status icon. From this report, you can view specifics about status issues as well as possible resolutions. This information can be emailed and exported. See
Emailing Reports and Dashboards and
Exporting Reports and Dashboards for details. For On-Demand runs, you can also:
• Download log files
• Download raw data
For additional information, use
Support Tools to download and inspect data collection logs:
Admin >Advanced > Support Tools. See also,
Data Collector Log Files for a description of the log file naming convention.
Using Reports to Monitor Data Collection Status
Use the following System Administration reports to use in conjunction with the Data Collection Status page to monitor the status of Data Collection: