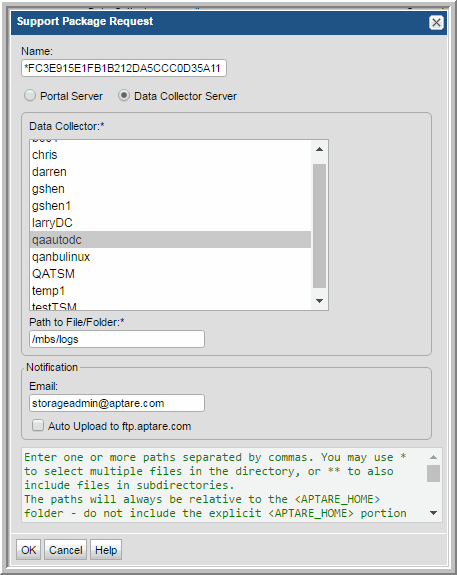
• Email: Enter your email address so that you can be notified when the package becomes available.

Policy Name | The type of system from which data is being collected, such as EMC VPLEX, Data Domain, or NetApp Cluster. The host name or IP address of the system that is the source of the data is appended to the product name, except for Host Resources collection. |
Collector Name | Name of the data collector. |
Collector Host Name | Name of host where data collector is deployed. Drill down to the Host Details. |
Probe Type Name | The type of data collection probe, such as Capacity, Performance, or Inventory. |
Schedule | The frequency of the data collection, such as Execute at 12:00 PM Daily. All times are relative to the Data Collector server. |
Last Start Time | The date and time the last successful data collection started. |
Last End Time | The date and time the last successful data collection ended. |
Last Duration | Length of the last successful collection cycle. A color indicator highlights durations that are 50% above the average duration. Note that the duration is calculated from the time the first set of data is persisted in the database until the last data from the collection thread is persisted. |
Average Duration | The average duration of all successful executions of this probe, including database persistence processes. |
Duration Delta | The % difference between the last successful duration and the average successful duration, which is an indicator of collection and database persistence performance. If the last duration is unknown, the delta will be unknown. |
# of Collections | Number of times the probe successfully collected data within the report scope. |
Total Duration | Total Duration = (# of Collections) * (Average Duration). This column is useful for sorting purposes, to identify long-running collection and database persistence processes. |
Collector Identifier | This metadata collector ID is useful for correlating collection events with the relevant log files. See also, Example of a Data Collector Log Request. For a VM, instead of a metadata ID, the name of the ESX server is listed in this table column. |
Collected Subsystem | IT Analytics Licensed Module | Why the data is not listed in the report |
File Analytics - CIFS | File Analytics | No explicit start and finish transactions are collected. |
Host Resources | Capacity Manager | May be supported in a future IT Analytics version. |
