Creating a Custom Report Template
From the Portal Menu Bar, select Tools > Templates > SQL Template Designer.
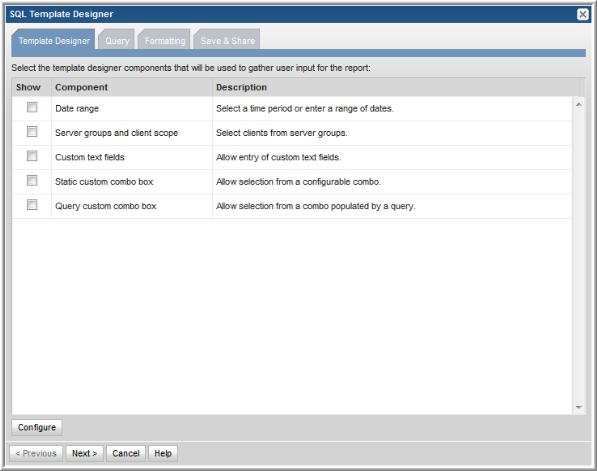
The initial display of the SQL Template Designer window displays:
• Tabs to navigate the configuration steps. Use either the tabs at the top of the window, or click Next at the bottom of the window.
Template Designer | Using the checkboxes, select which parameters you want the user to specify in the Scope Selector window when the report is generated. After you complete the selections within the tabbed Report Designer window, click Next to go to the window where you will Specify the SQL Query. |
Query | Type your SQL statement using the list of valid database views and fields at the bottom of the window. Click Validate Query to check your SQL statement for valid syntax before moving on to formatting and saving. This Validate Query task actually executes the query in order to validate the syntax. Seemingly simple queries could return a large amount of data and therefore may take some time to validate. See Specify the SQL Query. |
Formatting | To format the output for a report template, select the information that you want included in the report, as well as the report output style—Table, Bar Chart, Pie Chart, or Pivot Table. See Format the Output. |
Save & Share | Save and share report templates with others. You can select individual users or groups, and also the menu group in which it will appear. |
Configure Report Designer Scope Selector Components
When you create a report template, you must also determine what elements should be provided in the report’s Scope Selector—the interface that enables the user to specify the scope of the data to be displayed in the report. Each time a report is generated from the report template, the Scope Selector enables selection of parameters to be used for report generation.
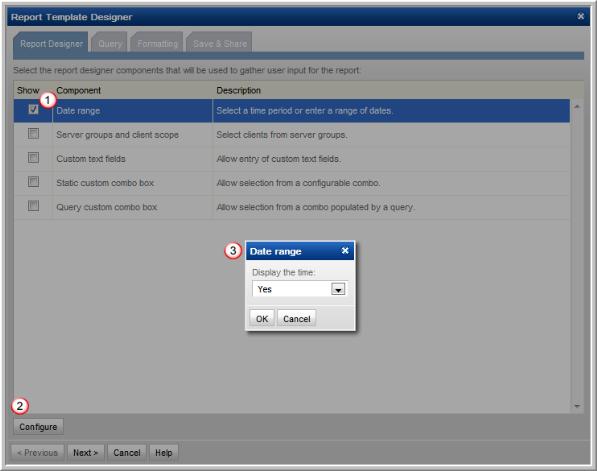
Date Range
Check this component to include a a Time Period and Data Range selector in the report’s Scope Selector that is displayed when generating the report.
1. Check Date range.
2. Select the Date range row and click Configure to display the Date range window.
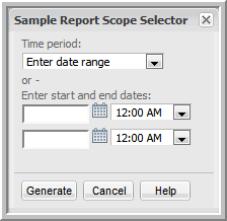
3. Configure the Date component to include the time with the date range. Choose Yes or No to specify if the time will be shown along with the date range in the Scope Selector. This configuration results in a report Scope Selector that includes the following:
Host Groups and Client Scope
This Report Designer component enables you to customize how the report will display the host groups’ data.
Use this configuration to specify if the cascade to sub-groups option is available and, if available, the default setting—Checked or Unchecked.
Custom Text Fields
In the Template Designer pane, a user can define fields that can have values substituted into a query. When the report is generated, the Scope Selector window presents the fields that can be selected, thus providing dynamic input for the report.
This option enables you to create up to three free-form text fields, where you can specify a field that you want to use in your query. For example, you might enter Host Name, so that when you form the query, you can specify a host name to be inserted into the query.
Example
The following steps illustrate the advantage of Custom Text Fields.
1. In the SQL Template Designer, select the Custom Text Fields component and click Configure.
2. In the Custom Text Fields window, define a field named Host ID and click OK.
3. To use this newly configured Custom Text Field, be sure to select the checkbox.
4. In the Query window, enter the following SQL query by typing a partial statement and then double-clicking to select fields:
select * from aps_v_host_volume where host_id > ${freeText1}
This query can be constructed by combining typing with double-clicking selections in the window, as shown in the following example:
The resulting query will be:
select * from aps_v_host_volume where aps_v_host_volume.host_id < ${freeText1}
5. Click Validate Query.
6. In the Formatting window, select all the fields for a table.
7. Save the report template with a name and a menu group.
8. Generate the report from this report template and in its Scope Selector window, provide a value for the Host ID field. This value will be passed to the query.
Static Custom Combo Box
The Report Designer Static Combo Box component enables the flexibility of offering the selection of various characteristics when the report is generated—similar to the way the out-of-the-box reports handle options, such as Event Type or Job Type. A Combo Box becomes available in the Scope Selector, enabling a user to select items from a drop-down list. This is particularly useful in environments where custom attributes have been defined for objects, enabling the user to select specific attributes at runtime.
Specify a heading, along with a list of values that will be displayed as a drop-down selection.
To include a blank or no choice option, specify the list of values in the form:
,option 1,option 2
If this no choice option is selected when the report is generated, an empty string will be passed to the SQL expression.
Example of a Combo Box
1. Create a Custom Combo Box to enable the user to select all hosts for a particular Make:
2. This Combo Box can be used in a report template query, such as:
select * from apt_v_server where apt_v_server.make = '${freeCombo1}'
Note: In this example, the Combo Box variable is a string, so it must be enclosed in single straight quotes to be evaluated as a text field, as shown in the above example.
3. Format this report as a table.
4. Save it as List Hosts by Make in a Menu Group.
5. Generate a report from this newly saved report template.
In this example, a Combo Box heading was specified with a list of values that will be presented in a drop-down list in the Report Designer, when the user generates the report:
6. Select a Make from the drop-down list and click Generate.
Query Custom Combo Box
The SQL Template Designer offers a feature to design a combo box that is populated with the results of the query. In addition to configuring the Query Custom Combo Box, a relevant report template query must be constructed to enable accurate report filtering using the combo box.
1. In the Template Designer component, double-click Query custom combo box to access the configuration window.
2. In the Heading field, enter the heading that will appear in the Report Designer with the drop-down list.
3. In the Custom Combo Box query field, supply a query with the following components and then click Validate.
SQL command | SELECT DISTINCT |
Key field, Field value | The comma-separated key-value pair is derived from a published view. For example: Key: storage_array_id Value: array_name The Key in the key-value pair is what will substitute the ${queryCombon} variable and the Value is shown in the Combo box. See the APTARE StorageConsole Database Programmer’s Reference Guide for descriptions of the published database views, including the available fields. In addition, these views and fields are available via the SQL Template Designer Query component. See Specify the SQL Query. |
Published view | End the SELECT statement with FROM and the published view, with optional list criteria. For example: FROM aps_v_array_group ORDER BY array_name ASC |
Sample Query Custom Combo Box Queries
SELECT DISTINCT server_id, server_name FROM apt_v_job
SELECT DISTINCT client_id, client_name FROM apt_v_job
SELECT DISTINCT product_type, product_type_name FROM apt_v_job
SELECT DISTINCT job_type, job_type_name FROM apt_v_job
SELECT DISTINCT vendor_status, vendor_status_name FROM apt_v_job
SELECT DISTINCT policy_id, policy_name FROM apt_v_nbu_job_detail
SELECT DISTINCT policy_type, policy_type_name FROM apt_v_nbu_job_detail
SELECT DISTINCT media_server_id, media_host_name FROM apt_v_nbu_job_detail
SELECT DISTINCT storage_array_id, array_name FROM aps_v_array_group
4. In the Query tab, enter a SQL query that will use the value selected in the populated combo box. For example:
Note: If the Combo Box variable is a string, it must be enclosed in single straight quotes to be evaluated as a text field. The above example is a numeric, so single quotes are not used.
Query Custom Combo Example: Ultimate NetBackup Job Status Report
In the SQL Template Designer Query Custom Combo box, enter: select window_group_id, window_group_name from apt_v_date_window order by window_group_name
Then, in the Query, use the following query to report Ultimate Job Status:
SELECT
a.nbu_job_id,
a.client_id,
b.client_host_name,
b.policy_name,
b.job_type_name,
decode(a.overall_status,0,'Success',
1,'Partial',2,'Queued',3,'Running','Failed') overall_status,
a.start_date,
a.finish_date,
a.kilobytes,
file_pathlist,
decode(was_restarted,1,'Y','N') was_restarted
FROM table (nbu_rtd.listJobSummaryAfterRestart (
${startDate},
${endDate},
${queryCombo1},
${spHosts},
null,
null,
null)) a
, apt_v_nbu_job_detail b
where a.job_id = b.job_id
Specify the SQL Query
The SQL Template Designer supports SQL select statements. You cannot specify UPDATE, DROP, ALTER, or CREATE statements.
To view the available database views and fields that can be used when you create a query, see the
APTARE StorageConsole Database Programmer’s Reference Guide. Also, for examples of queries, see
Sample Queries.
1. In the Query window, construct your select statement using the following tips:
• Use the drop-down list at the bottom left of the window to select views and fields.
• Use these lists to look up the valid tables, fields, and variables.
• To insert a view name into a query, double-click a field and then delete the field portion. For example, in the aps_v_database_datafiles_log view, click on datafile_id. Then, in the query, delete the .datafile_id portion.
• Double-click on fields to insert them into the query with the correct syntax.
• Double-click on variables in the list at the right of the window, to insert variables with proper syntax into the query—for example, ${endDate}
• If you checked Host Group and Client Scope in the initial tabbed Template Designer window, you’ll see that the drop-down list of Template Designer Variables (at the right of the window) includes Report Scope selections. Using these selections, you can enumerate a list of values for Host Groups (hostGroups) and Clients (hosts).
• All evaluated columns—for example, nvl(t2.das_capacity,0)—must have an alias name.
2. Click Validate Query.
• Correct the statement before you proceed. Use the available lists to view valid tables, fields, and variables.
Sample Queries
The following queries can serve as a starting point for how to create your own custom queries. In fact, you simply can copy and paste a query from these examples to demonstrate the results in the SQL Template Designer.
Example of a Report on Host Attributes
The following query lists all the attributes associated with a host/server:
select *
FROM apt_v_server_attribute
WHERE host_id IN (${hosts})
Using the apt_v_server_attribute View in Queries
The database view, apt_v_server_attribute, is dynamically created using the attributes that you create for your environment. When you initially look at this view, you only will see host_id and host_name. This view is recreated during the upgrade process, based on the attributes that you have configured.
If you add or modify server attributes in any way, in order to immediately use this view in queries in the SQL Template Designer, you will need to execute the following steps to manually recreate the apt_v_server_attribute database view:
1. Connect to the database as a Portal user:
sqlplus <userID>/<pwd>
2. Execute the following:
EXECUTE dynsql_pkg.recreateDynAttributeView;
3. Connect to the database as sysdb:
sqlplus / as sysdba
4. Execute the following:
CREATE OR REPLACE VIEW aptare_ro.apt_v_server_attribute AS SELECT * FROM portal.apt_v_server_attribute WITH READ ONLY;
Considerations for Attributes Used in SQL Template Designer Queries
The attribute database view, apt_v_server_attribute, is dynamically created from server attributes you enter in the Portal. During the creation of this database view, several rules are applied to facilitate the use of this view in queries in the SQL Template Designer. When you see the attribute names listed in the SQL Template Designer Formatting tabbed window, you’ll see that the following conversions have been made to your Attribute Names—that is, the view’s column names.
• All characters are lowercase.
• Special characters, such as “:” or “/” or a space, are converted to an underscore.
• If the attribute name begins with a number or a special character, it will be replaced with: c_
• If the conversion process results in duplicate names, the attribute name will have a suffix appended to differentiate the duplicates; for example: _1 or _2
• Names are truncated to 30 characters.
Example of a Report of Failed Backup Jobs
The following example results in a list of failed jobs.
1. In the SQL Template Designer, check both Date Range and Host Groups and Client Scope.
2. In the Query window, enter the following select statement and click Validate Query:
SELECT apt_v_job.job_id,apt_v_job.client_id, apt_v_job.client_name,
apt_v_job.server_id, apt_v_job.server_name,
apt_v_job.start_date,apt_v_job.vendor_state_name,
apt_v_job.vendor_status_name
FROM apt_v_job
WHERE apt_v_job.summary_status = 2 --Failed jobs
AND apt_v_job.start_date > ${startDate}
AND apt_v_job.start_date < ${endDate}
AND apt_v_job.client_id IN (${hosts})
3. In the Formatting window, select the fields to be displayed. For this example, it makes sense to Select All and display the report as a Table.
4. Click Next, enter a report name and select a Menu Group. Then, click Finish.
5. When you run this report, specify either a time period or start and end dates. You also can modify the scope to generate the report for a specific host group. The output will look something like this:
Example of a Host Group Membership List
The following example reports on host group membership, in display name order.
1. In the SQL Template Designer, check only Host Groups and Client Scope.
2. In the Query window, enter the following select statement and click Validate Query:
SELECT g.group_name, s.server_id, s.display_name client,
s.hostname, s.ip_address
FROM apt_v_group_member m, apt_v_group g, apt_v_server s
WHERE g.group_id = m.group_id
AND m.child_type = 2 --Server (excludes children that are host groups)
AND m.child_id = s.server_id
AND s.server_id IN (${hosts})
ORDER BY s.display_name, g.group_name
3. In the Formatting window, select the fields to be displayed. For this example, it makes sense to select all and display the report as a Table.
4. Click Next, enter a report name and select a Menu Group. Then, click Finish.
5. When you run this report, you can modify the scope to generate the report for a specific host group. The output will look something like this:
Note that the column header “client” was substituted for the field name, as specified in the query. You can specify similar substitutions using the Formatting window in the SQL Template Designer.
6. Since this query is ordered by display name and then group name, it may be more reasonable to display the output in a similar fashion. Use the Formatting tab to re-arrange the table columns (Move Up, Move Down). See
Format the Output.
Example of an Exposed Clients Report
The following example lists the clients within the report scope that have not been backed up within the selected time frame.
1. In the SQL Template Designer, check both Date Range and Host Groups and Client Scope.
2. In the Query window, enter the following select statement and click Validate Query:
SELECT apt_v_job.client_id, apt_v_job.client_name, apt_v_job.server_id,
apt_v_job.server_name
FROM apt_v_job
WHERE apt_v_job.client_id IN (${hosts})
AND apt_v_job.summary_status IN (0,1) -- Success or Warning
HAVING MAX(start_date) < ${startDate}
GROUP BY apt_v_job.client_id, apt_v_job.client_name, apt_v_job.server_id,
apt_v_job.server_name
3. In the Formatting window, select the fields to be displayed. For this example, it makes sense to select all and display the report as a Table.
4. Click Next, enter a report name and click Finish.
5. When you run this report, specify the start and end dates or a time period. So, for example, you could select Last 72 Hours and it will be substituted for startDate, listed in the query. You can modify the scope to generate the report for a specific host group. The output will look something like this:
Example of Listing Jobs With Notes
The following example lists the jobs with notes within the selected time frame, ordered by server, host, job start date, and note entry date. This particular report provides a quick look at jobs that may need attention because someone has attached a note to the job.
1. In the SQL Template Designer, check both Date Range and Host Groups and Client Scope.
2. In the Query window, enter the following select statement and click Validate Query:
SELECT n.note_date, n.user_id, n.user_note, j.client_name, j.server_name,
j.job_type_name, j.start_date, j.finish_date
FROM apt_v_job j, apt_v_job_note n
WHERE j.job_id = n.job_id
AND j.client_id IN (${hosts})
AND j.start_date BETWEEN ${startDate} AND ${endDate}
ORDER BY j.server_name, j.client_name, j.start_date, n.note_date
3. In the Formatting window, select the fields to be displayed. For this example, it makes sense to select all and display the report as a Table.
4. Click Next, enter a report name and click Finish.
5. When you run this report, try these selections:
• Time Period: Month-to-Date
• Check Cascade into sub-groups
The output will look something like this:
Example of a Pie Chart for Job Size by Job Type
The following example creates a pie chart that represents the various job types—such as, application backups, full backups, incremental backups, and restores—as segments in a pie chart.
1. In the SQL Template Designer, do not check any Report Designer items.
2. In the Query window, enter the following select statement and click Validate Query:
SELECT job_type_name,
sum(kilobytes/1024/1024) Job_SIZE_GB
FROM APT_V_NBU_JOB_DETAIL
WHERE
finish_date > sysdate -7
AND job_type_name IS NOT NULL
GROUP BY job_type_name
ORDER BY job_type_name
3. In the Formatting window, select Pie Chart from the Display report as drop-down list.
4. For the Caption field, select job_type_name from the drop-down list.
5. Select all the fields to be displayed.
For a pie chart, you need at least one field to be the caption and another field to be the segment.
6. Click Next, enter a report name and Menu Group. Then, click Finish.
7. When you run this report, the output will look something like this:

Example of the SQL Custom Join Feature
Backup Exec data collection does not populate tables related to tape media—for example, apt_v_tape_media. To include this view in a query so that it will work with Backup Exec data, you’ll need to use an “outer join” (as denoted with (+) in the following query).
select apt_v_job.server_name, apt_v_job.job_type, apt_v_job_tape_media.media_name, apt_v_job.client_name, to_char(apt_v_job.start_date, 'YYYY-MM-DD hh:mm:ss AM') start_date, to_char(apt_v_job.finish_date, 'YYYY-MM-DD hh:mm:ss AM') finish_date, apt_v_job.summary_status, apt_v_job_message_log.message, apt_v_job_tape_media.tape_media_id, apt_v_job.kilobytes
from apt_v_job, apt_v_job_tape_media, apt_v_job_message_log
where apt_v_job.job_id = apt_v_job_tape_media.job_id (+)
and apt_v_job.job_id = apt_v_job_message_log.job_id
and apt_v_job.server_id in (${rp.hosts})
and apt_v_job.start_date BETWEEN ${rp.startDate} AND ${rp.endDate}
ORDER BY apt_v_job.server_name, apt_v_job.start_date
Example of NetBackup Catalog Space by Client List
This example demonstrates how to include sums of a field.
1. In the SQL Template Designer, check Host Groups and Client Scope.
2. In the Query window, enter the following select statement and click Validate Query:
SELECT client_host_name, sum(nbr_of_files),sum(nbr_of_files)*150/1024/1024
FROM apt_v_nbu_job_detail
WHERE client_id in (${hosts})
AND summary_status is not null
AND expiration_date <= sysdate
GROUP BY client_host_name
ORDER BY sum(nbr_of_files) DESC
3. In the Formatting window, select all the fields to be displayed and display the report as a Table.
4. Click Next, enter a report name and click Finish.The output will look something like this: