Working with Dashboards
Acting as a canvas, dashboards provide an at-a-glance overview by displaying many reports on a single page. You can drag and drop individual reports, to create a consolidated view into your storage environment. You can create a dashboard to contain reports you access regularly, or view multiple scenarios simultaneously. Dashboards can also help you troubleshoot a particular problem by gathering data from multiple reports into one view.
This section covers:
To create a dashboard and add reports
1. Search and generate each report you want on your dashboard. Each report will display in a separate tab.
2. Click the
Add Dashboard tab, once all the reports are generated.
3. Click and drag the tab of each report you want to place on the dashboard. You can add an unlimited number of reports to a custom dashboard.
Note: A report that has been generated as a result of a drill down in another report cannot be saved or added to a dashboard because of the dependency with the parent report.
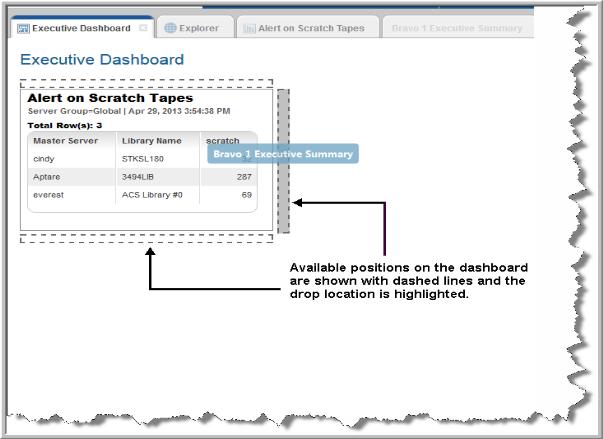
4. As you drag the report on to the dashboard, areas are highlighted indicating the potential positions of the report. You can change their location by dragging them to a new position.
5. Click Actions and select Save.
6. Assign a name to the dashboard. The maximum number of characters is 80.
Note: Reports on dashboards are treated as stand-alone instances and are not linked to the original report. For example, when a name or scope change is made in the original report, those changes are not reflected in the dashboard version.
To add reports to an existing dashboard
1. Search for the dashboard name using Quick search.
2. Run the dashboard directly from the search results. The updated dashboard is displayed.
3. Search and generate each report you want to add to your dashboard. Each report will display in a separate tab.
4. Click and drag the tab of each report you want to place on the dashboard. You can add an unlimited number of reports to a dashboard, but you are limited to four horizontal columns.
Note: A report that has been generated as a result of a drill down in another report cannot be saved or added to a dashboard because of the dependency with the parent report.
5. As you drag the report on to the dashboard, areas are highlighted indicating the potential positions of the report. You can change their location by dragging them by the title to a new position.
6. Click Actions and select Save.
To save a dashboard as a different name
1. Open a saved dashboard.
2. Click
Actions and select
Save As.
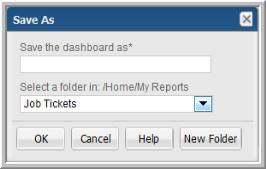
3. Enter a descriptive dashboard name.
4. Choose a folder or create a new folder within your My Reports folder.
To edit the scope for a report on a dashboard
You can edit the scope for an individual report on a dashboard. This allows you to create what-if analyses or troubleshoot an issue by changing the data set and creating a preview report. Once you’ve changed the scope, regenerate the report. The report title is displayed in red italic to indicate a change has occurred. You can save your changes or just close the dashboard to retain the original scope.
1. Search for the dashboard name using Quick search. You can also browse for it using the Explorer.
2. Run the dashboard directly from the search results. The updated dashboard is displayed.
3. Roll your cursor over the corner of a report on the dashboard to display the Edit Scope icon.
4. Click the Edit Scope icon to display the Scope Selector for the report.
5. Regenerate the report. The report title and the dashboard name are shown in red italics to indicate a change has been made to the dashboard.
6. Save the changes to update the dashboard with the new scope. You can also close the dashboard to discard the scope changes and retain the original scope.
To delete a dashboard
Use the information displayed in the Explorer tab to help assess the impact of deleting a dashboard. For example, you can determine if you’ve shared your dashboard with other users.
1. Locate and select the dashboard on the Explorer.
2. Click Delete and the Action bar.
Working with Reports on a Dashboard
Once placed on a dashboard, you can expand and collapse reports based on page real estate. These functions are displayed when you hover your cursor over the report title. You can change a report location by simply dragging it to a new position.
Removing Reports from Dashboards
As you use your dashboards, you may find that some reports are no longer relevant. These reports can be quickly removed from your dashboard.
To remove a report from a dashboard
1. Search for the dashboard name using Quick search.
2. Run the dashboard directly from the search results. The updated dashboard is displayed.
3. Hover your cursor over the report title. The icons are displayed.
4. Click the Remove icon. You can reposition the remaining reports by dragging them by the title to new locations.