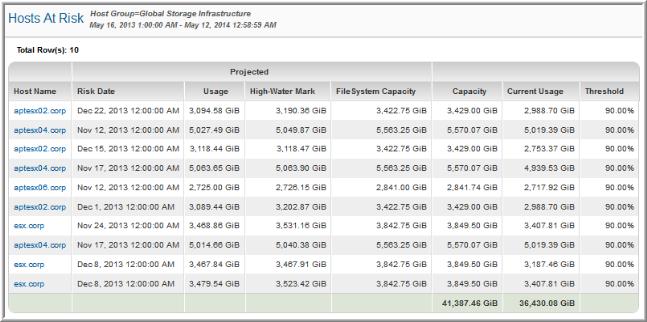
Hosts at Risk
Use Quick Search to find a template, report or dashboard by name. Search is case insensitive, supports partial entries, and will display a list of potential matches.
As you enter the name in the Quick Search field, up to 10 potential matches are displayed. If the template, report or dashboard is shown, you can select and run it directly from the match list. You can also click All Items in the match list to go directly to the Search Results.
Use the Explorer to browse through the StorageConsole templates, dashboards and reports. The navigation pane displays templates organized by products along with user created, and system folders. This report is located here:
Capacity Manager > Capacity At Risk > Hosts At Risk
When you generate this report, select a capacity threshold: Low, Warning, or Critical. Typically, for at risk reports, you will want to view the Critical hosts—that is, those that are at risk of breaching the critical threshold.
In the report’s scope selector, the Host Type option can be used to include virtual hosts in this host-based report: VM Guest, VM Server, VIO Guest, VIO Server, or Other.
This report lists only the hosts that require your immediate attention. Use the host link to view details.
Note: When reviewing the values in this report, note that hosts at risk are determined by evaluating current and projected usage.
Host Name | Click a host name to access details in the Host Utilization Detail. |
Risk Date (Projected) | The date that the host is projected to exceed its threshold and will no longer be considered over-provisioned. |
Usage (Projected) | Projected usage associated with the risk date. |
High-Water Mark (Projected) | The high-water mark represents the maximum usage for a period. Note that this size may represent temporary usage. |
FileSystem Capacity | The filesystem capacity |
Capacity | The host’s storage limit. |
Current Usage | Storage already consumed. |
Threshold | A host becomes at risk when this tolerance threshold is crossed. The default thresholds are set at: Low = 30%; Warning = 70%; Critical = 90%. To modify thresholds for a particular host, go to the Portal’s Admin toolbar: Admin > Threshold Policies. |

