Aggregated Chargeback
Use Quick Search to find a template, report or dashboard by name. Search is case insensitive, supports partial entries, and will display a list of potential matches.
As you enter the name in the Quick Search field, up to 10 potential matches are displayed. If the template, report or dashboard is shown, you can select and run it directly from the match list. You can also click All Items in the match list to go directly to the Search Results.
Use the Explorer to browse through the StorageConsole templates, dashboards and reports. The navigation pane displays templates organized by products along with user created, and system folders. This report is located here:
Capacity Manager > Chargeback and Billing > Aggregated Chargeback
This Capacity Chargeback report enables you to aggregate the data by Host Groups or by a particular host attribute (for example, Department).
The Report Designer provides both a filtering and a grouping mechanism.
• Host Groups are used to filter or narrow the scope and content of the report.
• Host Groups and Attributes are used to aggregate the data—that is, a grouping mechanism. Note that Attributes are from the host’s perspective.
• If you choose only Host Groups (without an Attribute), the report will be filtered on the selected Host Groups and also will be grouped by Host Group.
• Allocate Duplicate Host to All, when checked, reports duplicate host usage in all Host Groups, if hosts are in more than one host group.
• Allocate Duplicate Host to All, when unchecked, reports duplicate host usage only in the first alphabetical host group.
Capacity Chargeback Policies are configured by the StorageConsole Administrator. The administrator uses these policies to assign a cost-per-GB to hosts in a host group.
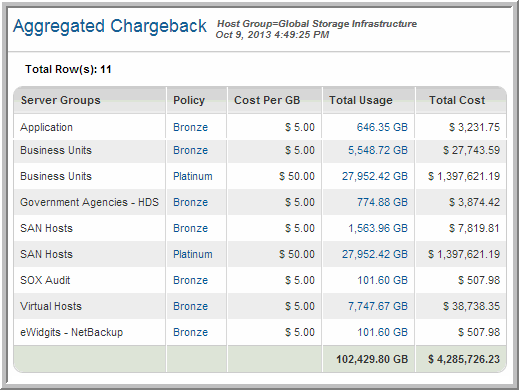
Aggregated Chargeback by Host Groups
When you do not select an Attribute in the Report Designer, the report is organized by Host Groups.
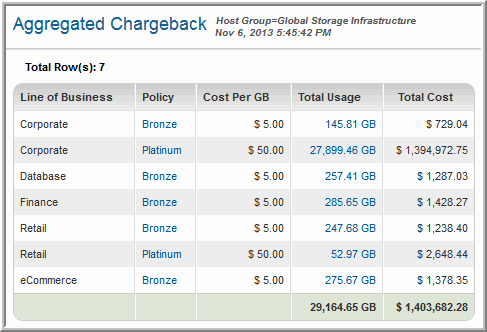
Host Groups OR <Attribute Name> | Host group to which the policy applies; if an Attribute was selected in the Report Designer the values are displayed in Attribute alphabetical order. |
Policy | Links to Policy Detail. |
Cost Per GB | The unit cost configured in the policy. |
Total Usage | Links to Chargeback Detail. |
Total Cost | Cost-per-GB * Total Usage. |
Aggregated Chargeback by Attribute
When you select an Attribute in the Report Designer, the report is organized by that Attribute.
Chargeback Detail
Detail reports are related to a specific enterprise object, such as a backup job or SAN fabric. You can only access detail reports through a link presented in the context of a main report, providing additional information that augments the main report. Detail reports cannot be generated, customized, or saved, as they are specific to the report from which they were derived. Therefore, they will not be available in search results.
Use Quick Search to find the main template, report or a dashboard by name. Search is case insensitive, supports partial entries, and will display a list of potential matches.
As you enter the template, dashboard or report name in the Quick Search field, up to 10 potential matches are displayed. If the result is shown, you can select and run it directly from the match list. You can also select All Items to display the full search results page and further filter your results.
You can use the Explorer to browse through the StorageConsole templates, dashboards and reports. The navigation pane displays templates organized by products along with user created, and system folders. The main report is located here:
Capacity Manager > Chargeback and Billing > Aggregated Chargeback
Click a Total Usage link.
Host | Links to the Host Utilization Detail. |
Policy | Links to the Chargeback Policy. |
Array | Links to the Array Capacity & Utilization. |
LUN | Links to the LUN Utilization Summary. |
Unit Cost | The per-unit amount configured in the Capacity Chargeback Policy. |
Total Usage | Total amount of storage in use. |
Total Cost | Cost-per-GB * Total Usage. |


