Best Practices: Interconnected switches should be configured in the same Data Collector policy.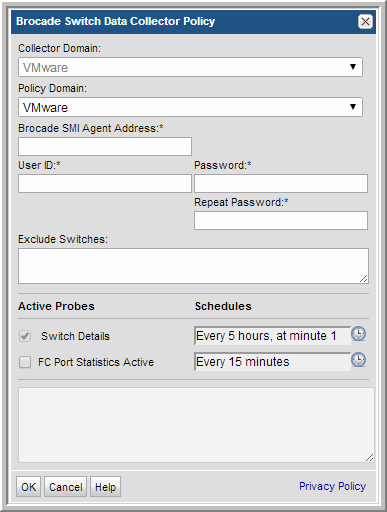

Field | Description | Sample Values |
Collector Name* | Click Change to edit the unique name assigned to this Data Collector. The Data Collector will use this value for authentication purposes. Changing the Collector ID or passcode requires manual changes to the corresponding Data Collector server. Collection will break if these corresponding changes are not made. See User ID and Passcode on the Data Collector Server. | BUEdc1 TSMdc1 HRdc1 |
Passcode* | Click Change to edit the passcode assigned to this Data Collector. It can be any character sequence. Unlike other Storage Viewer passwords (which are encrypted and then saved) this Data Collector passcode is not encrypted prior to saving in the Storage Viewer database and may appear as clear case in certain files. It simply is intended as a “handshake” identification between the data collector and the policy. Changing the Collector ID or passcode requires manual changes to the corresponding Data Collector server. Collection will break if these corresponding changes are not made. See User ID and Passcode on the Data Collector Server. | Password1 |
Short Notes | Descriptive notes associated with this Data Collector. | |
Enable SSL | Both secure (SSL) and non-secure Data Collectors can send data to the same Portal. Check this box to select the secure communication protocol (https) that the Data Collector will use. This check box will not appear in the dialog box if SSL is not enabled in your environment. The Portal data receiver must be listening for https traffic; for example: https://agent.mycollector.com | |
Auto-upgrade aptare.jar | Indicate if you want this configuration file upgraded automatically. This part of the Data Collector is responsible for event and metadata processing threads. The .jar file contains the processing and parsing logic for data collection. The latest versions can be downloaded automatically and applied to the collector during upgrades. It is recommended that this setting be set to Yes. | Yes |
Auto-upgrade Upgrade Manager | Indicate if you want this configuration bundle upgraded automatically. This data collector component is responsible for managing Data Collector upgrades. The latest versions can be downloaded automatically and applied to the collector during upgrades. It is recommended that this setting be set to Yes. | Yes |

Field | Description | Sample Value |
Collector Domain | The domain of the collector to which the collector backup policy is being added. This is a read-only field. By default, the domain for a new policy will be the same as the domain for the collector. This field is set when you add a collector. | |
Policy Domain | The Collector Domain is the domain that was supplied during the Data Collector installation process. The Policy Domain is the domain of the policy that is being configured for the Data Collector. The Policy Domain must be set to the same value as the Collector Domain. The domain identifies the top level of your host group hierarchy. All newly discovered hosts are added to the root host group associated with the Policy Domain. Typically, only one Policy Domain will be available in the drop-down list. If you are a Managed Services Provider, each of your customers will have a unique domain with its own host group hierarchy. To find your Domain name select Admin > Hosts and Domains > Domains. | yourdomain |
Brocade SMI agent address* | Enter the IP address of the Brocade SMI agent and port number in the format: <ip_address>:port_number The port number is NOT required if you want to use the default port numbers: 5988 (http) or 5989 (https). | 192.1.1.1 |
User ID* | Use the User ID and passcode for accessing the switch. This typically would be an administrator privilege, but must be a minimum privilege of a view-only user. | Administrator |
Password* | Note: The password is encrypted prior to saving in the database and is never visible in any part of the application. | Password1 |
Exclude Switches | Enter a switch WWN - e.g., 10:00:00:60:69:90:04:9F, 100000606990049F Colons within the WWN are NOT required. A comma-separated list is supported. | 10:00:00:60:69:90:04:9F, 100000606990049F |
Switch Details | Click the check box to collect switch details. Click the clock icon to create a schedule. Every Minute, Hourly, Daily, Weekly, and Monthly schedules may be created. Relative schedules are relative to when the Data Collector is restarted. Advanced use of native CRON strings is also available. Examples of CRON expressions: */30 * * * * means every 30 minutes */20 9-18 * * * means every 20 minutes between the hours of 9am and 6pm */10 * * * 1-5 means every 10 minutes Mon - Fri. | |
FC Port statistics Active | Click the check box to collect FC Port statistics. This may have a performance impact, which can be optimized with the FC Port statistics schedule. Click the clock icon to create a schedule. |
Field | Description | Sample Value |
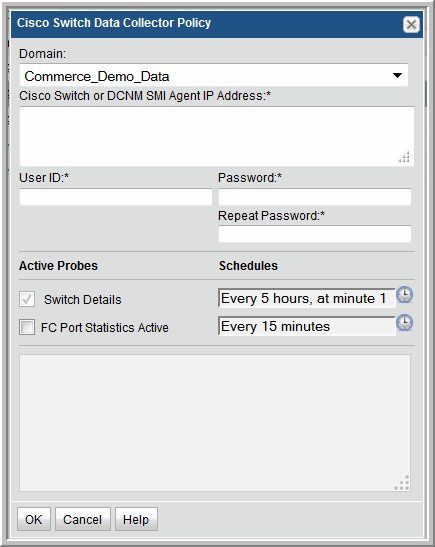
Domain | The domain identifies the top level of your host group hierarchy. The name was supplied during the installation process. All newly discovered hosts are added to the root host group associated with this domain. Typically, only one Domain will be available in the drop-down list. If you are a Managed Services Provider, each of your customers will have a unique domain with its own host group hierarchy. To find your Domain name select Admin > Hosts and Domains > Domains. | yourdomain |
Cisco switch or DCNM SMI Agent IP address* | Enter the IP address of the Cisco switch. Multiple switch IP addresses, separated by commas, can be entered for this field. Interconnected switches, which share the same VSAN, must be included in the same Data Collector policy. If you are using the Data Center Network Manager (DCNM) for central control, a separate Data Collector policy is needed for each DCNM. Enter the DCNM SMI agent address (and optionally, its port number) in the format: <ip_address>:<port_number> For DCNM v6.2.x, you will need a valid (or temporary) license in order for the SMI agent to be able to get data. | 192.1.1.1 |
User ID* | Use the User ID and passcode for accessing the switch. This typically would be an administrator privilege, but must be a minimum privilege of a view-only user. | Administrator |
Password* | Note: The password is encrypted prior to saving in the database and is never visible in any part of the application. | Password1 |
Switch Details | Click the check box to collect switch details. Click the clock icon to create a schedule. Every Minute, Hourly, Daily, Weekly, and Monthly schedules may be created. Relative schedules are relative to when the Data Collector is restarted. Advanced use of native CRON strings is also available. Examples of CRON expressions: */30 * * * * means every 30 minutes */20 9-18 * * * means every 20 minutes between the hours of 9am and 6pm */10 * * * 1-5 means every 10 minutes Mon - Fri. | |
FC Port Statistics Active | Click the check box if you want to collect FC Port statistics. This may have a performance impact, which can be optimized with the FC Port schedule. |
cimserver status | To execute this command, you need to be in enable mode. |
show cimserver | |
config t | This puts you into configuration mode. |
cimserver enable | Once you are in configuration mode, this command turns on the SMI-S provider. |
Field | Description | Sample Value |
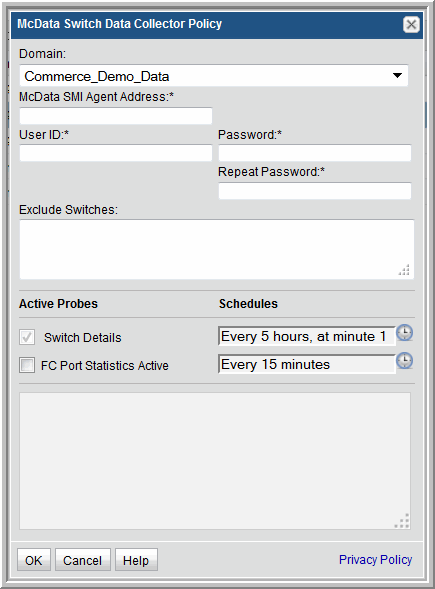
Domain | The domain identifies the top level of your host group hierarchy. The name was supplied during the installation process. All newly discovered hosts are added to the root host group associated with this domain. Typically, only one Domain will be available in the drop-down list. If you are a Managed Services Provider, each of your customers will have a unique domain with its own host group hierarchy. To find your Domain name select Admin > Host and Domains > Domains. | yourdomain |
McData SMI agent address* | Enter the IP address of the McData switch. | 192.1.1.1 |
User ID* | Use the User ID and passcode for accessing the switch. This typically would be an administrator privilege, but must be a minimum privilege of a view-only user. | Administrator |
Password* | Note: The password is encrypted prior to saving in the database and is never visible in any part of the application. | Password1 |
Exclude Switches | Enter a switch WWN - e.g., 10:00:00:60:69:90:04:9F, 100000606990049F Colons within the WWN are NOT required. A comma-separated list is supported. | 10:00:00:60:69:90:04:9F, 100000606990049F |
Switch Details | Click the check box to collect switch details. Click the clock icon to create a schedule. Every Minute, Hourly, Daily, Weekly, and Monthly schedules may be created. Relative schedules are relative to when the Data Collector is restarted. Advanced use of native CRON strings is also available. Examples of CRON expressions: */30 * * * * means every 30 minutes */20 9-18 * * * means every 20 minutes between the hours of 9am and 6pm */10 * * * 1-5 means every 10 minutes Mon - Fri. | */15 * * * * |
FC Port Statistics Active | Click the check box if you want to collect FC Port statistics. This may have a performance impact, which can be optimized with the FC Port schedule. Click the clock icon to create a schedule. |