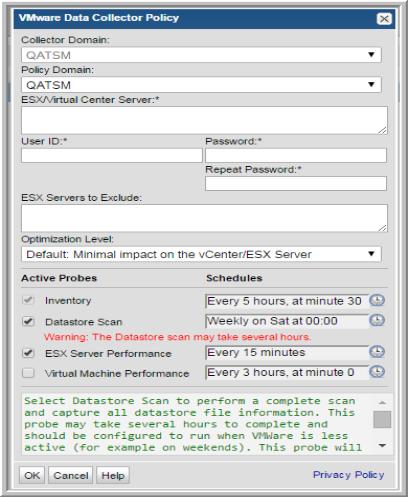
3. Configure the VMware Data Collector policy .
.
 .
. .
.Field | Description | Sample Value |
Collector Domain | The domain of the collector to which the collector backup policy is being added. This is a read-only field. By default, the domain for a new policy will be the same as the domain for the collector. This field is set when you add a collector. | |
Policy Domain | The Policy Domain is the domain of the policy that is being configured for the Data Collector. The Policy Domain must be set to the same value as the Collector Domain. The domain identifies the top level of your host group hierarchy. All newly discovered hosts are added to the root host group associated with the Policy Domain. Typically, only one Policy Domain will be available in the drop-down list. If you are a Managed Services Provider, each of your customers will have a unique domain with its own host group hierarchy. To find your Domain name select Admin > Hosts and Domains > Domains. | |
ESX/Virtual Center Server* | One or more IP addresses or host names to probe. Comma-separated addresses or IP ranges are supported. If the server requires an SSL certificate, refer to Adding a Certificate to the Java Keystore for instructions. | 192.168.0.1-250, 192.167.1.10, myhost |
User ID* | The view-only VMware user ID that has a role with the following privileges: Read-Only and Browse Datastore. | |
Password* | The password associated with the User ID. | |
ESX Servers to Exclude | Enter one or more ESX server names or IP addresses. Comma-separated names/addresses or IP ranges are supported. | |
Optimization Level | Select an optimization level for your VMWare data collection. Choose from default, aggressive, or none. Each selection impacts runtime differently. Effects will be most noticeable when running the Datastores collection. | |
Inventory | By default, this probe collects data from VMware using the defined schedule. For performance reasons, this collection only gathers information on files currently in use by VMs collected by this probe. This includes VM disk files, suspended state, etc. Due to limitations in the data returned from VMWare, this probe may miss certain files, such as ISO files that are attached to virtual DVD drives. To capture all datastore file information including the files associated with VMs in the inventory, select the check box: Datastore Scan. If the Datastore Scan probe is not regularly run, the Datastore Usage Breakdown report is likely to have a large Unknown category. For additional information, see Datastore Scan Collection and Reports Impacted by Datastore Collection. Click the clock icon to create a schedule. Every Minute, Hourly, Daily, Weekly, and Monthly schedules may be created. Advanced use of native CRON strings is also available. NOTE: Explicit schedules set for a Collector policy are relative to the time on the Collector server. Schedules with frequencies are relative to the time that the Data Collector was restarted. | */30 * * * * |
Datastore Scan | Select Datastore Scan to perform a complete scan and capture all datastore file information. This probe may take several hours to complete and should be configured to run when VMWare is less active (for example on weekends). This probe will find files that are not discoverable using the Inventory probe but are consuming space on the datastore. After this probe has run the Datastore Usage Breakdown report will normally only have a small Unknown category, however, there usually will be some Unknown data, representing file system overhead and internal VMWare disk structures that are not reported as files. Only enable this probe when actively looking for files that may be wasting space in the datastores. For additional information, see Datastore Scan Collection. Click the clock icon to create a schedule. Every Minute, Hourly, Daily, Weekly, and Monthly schedules may be created. Advanced use of native CRON strings is also available. NOTE: Explicit schedules set for a Collector policy are relative to the time on the Collector server. Schedules with frequencies are relative to the time that the Data Collector was restarted. | |
ESX Server Performance | Select ESX Server Performance to collect performance data for ESX servers. Click the clock icon to create a schedule. Every Minute, Hourly, Daily, Weekly, and Monthly schedules may be created. Advanced use of native CRON strings is also available. NOTE: Explicit schedules set for a Collector policy are relative to the time on the Collector server. Schedules with frequencies are relative to the time that the Data Collector was restarted. | |
Virtual Machine Performance | Select this probe to collect performance data from virtual machines. This probe may need to be run less often than the ESX Server Performance probe because there are usually more virtual machines than ESX servers. This probe may be disabled if it is not necessary to monitor the performance of individual virtual machines. When the default schedule of once every 3 hours is used, the Data Collector will use vCenter’s 5-minute summaries for part of the data or, if collecting directly from an ESX server, there may be gaps in the data. To ensure that real-time data is always used (subject to the statistics level that is set), or if collecting from an ESX server, change the schedule of this probe to every hour (or more frequently). Click Help to view the statistics level settings in the Best Practice to Improve Performance. Click the clock icon to create a schedule. Every Minute, Hourly, Daily, Weekly, and Monthly schedules may be created. Advanced use of native CRON strings is also available. NOTE: Explicit schedules set for a Collector policy are relative to the time on the Collector server. Schedules with frequencies are relative to the time that the Data Collector was restarted. |
Report | Default Inventory | Collect all files on datastore |
VM Files Summary (drilldown) | • No Last Modified date. • Total # files collected will usually be less than with an all files collection. | Last Modified date will be missing for files not found in the datastore scan. |
Datastore Usage Breakdown | • Non-VM Files and VM Not In Inventory will be zero. • Total VM Used will be reduced by the amount that would have been collected as VM Not In Inventory if an all files collection had been done. • Unknown category in the pie chart will often be significantly higher than if an all files collection had been done. | The Unknown category in the pie chart will usually be non-zero and will often be significantly higher than the default inventory collection. |
Datastore Utilization | • VM Not In Inventory will be zero. • Total VM Used will be reduced by the amount that would have been collected as VM Not In Inventory if an all files collection had been done. | |
Datastore Detail | • Non-VM Files and VM Not In Inventory will be zero. • Total VM Used will be reduced by the amount that would have been collected as VM Not In Inventory if an all files collection had been done. | VMDK and Other VM Files values typically will not be impacted by the datastore collection type. |
VM Server Detail | • VM Not In Inventory will be zero • Total VM Used will be reduced by the amount that would have been collected as VM Not In Inventory if an all files collection had been done. | Last Modified date will be missing for files not found in the datastore scan. |
VM Detail | • No Last Modified date. • Total # files collected will usually be less than with an all files collection. | |
VM Snapshot Summary | • No Last Modified date. |