Job Duration Report
Use Quick Search to find a template, report or dashboard by name. Search is case insensitive, supports partial entries, and will display a list of potential matches.
As you enter the name in the Search field, up to 10 potential matches are displayed. If the template, report or dashboard is shown, you can select and run it directly from the match list. You can also click All Items in the match list to go directly to the Search Results.
Use the Explorer to browse through the StorageConsole templates, dashboards and reports. The navigation pane displays templates organized by products along with user-created, and system folders. This report is located here:
Backup Manager > Management Reports > Job Duration
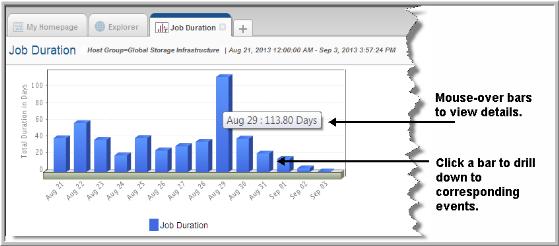
The Job Duration report combines into one view, information about both backup and restore duration. If, on a specific day, there were two backup events that completed after 1 hour and 3 hours respectively, and one restore completed after .5 hours, the bar reports a duration of 4.5 hours.
You can also report on a single event type:
• All Backup Events
• Full Backups
• Incremental Backups
• Restores

The Job Duration report provides the following information:
Drillable Bars in Chart | Click on any of the bar sections to go to a Job Summary Report for all corresponding events. |
Pop-up Details | Mouse‑over any of the bars or symbols on the chart to display pop-ups that provide details. This pop-up lists the total duration for the selected time period. |
Duration | The total amount of time the backup and restore events took to complete. If on a specific day there were two backup events that completed after 1hr and 3hrs respectively, and one restore completed after .5 hours, the bar reports a duration of 4.5 hours. |
Use this report as a starting point to determine why certain days show excessive backup durations.
To diagnose excessive backup durations:
1. View the Job Duration bar chart, looking for excessive duration times.
3. In the Job Summary Report, click on the Duration column header to sort the data by Duration. Now you’ll see excessive client usage at the top of the list. You might also sort by MBytes/Sec to identify throughput issues.
4. In the
Job Summary Report, click on the
Finish Date of a suspect job to display the
Job Details Report.
By using a combination of reports, you can figure out if some jobs held up others, if there are server problems that require your attention, or if consecutive errors are symptomatic of storage device failure or media degradation.


