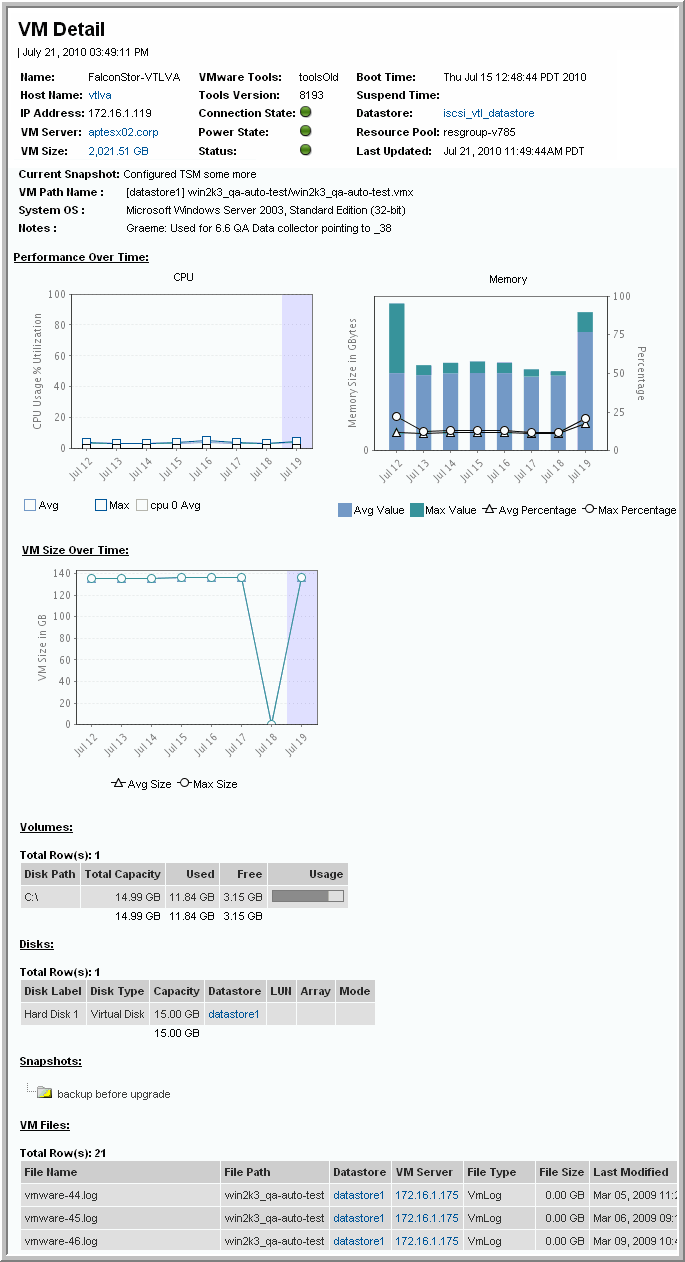

Name | Name of the virtual machine |
Host Name | Hostname of the guest; value is displayed only if VMTools is installed |
IP Address | IP address of the Virtual Machine; value is displayed only if VMTools is installed |
VM Server | Links to the VM Server Detail report |
VM Size | Amount of storage the VM takes up |
VMware Tools | Indicates if the VMware tools have been installed for the guest operating system |
Tools Version | Version of the VMware tools that are running on the guest operating system |
Connection State | None, Powered Off, Powered On, or Suspended |
Power State | None, Powered Off, Powered On, or Suspended |
Status | Gray=Status Unknown, Green=Normal, Yellow=Warning, Red=Alert, definite problem |
Boot Time | The VM’s power-on time |
Suspend Time | The time when the VM was put in a suspended state |
Datastore | The datastore to which the VM belongs Links to the Datastore Detail report |
Resource Pool | The resource pool (compartment) to which the VM belongs |
Last Update Date | The last time the VM configuration was updated |
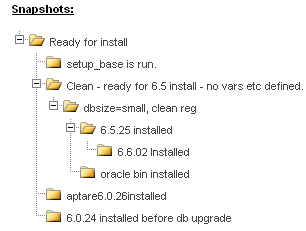
Current Snapshot | Path and name of the current snapshot |
VM Path Name | The file path in datastore format, for example: [storage] win2k/testing/bue11dtesting.vmx |
System OS | Guest operating system running on the VM |
Notes | The annotation field of the VM |
CPU | The CPU average and maximum usage to date. |
Memory | The Memory average and maximum usage to date. |
Disk Label | The label of the physical disk |
Disk Type | RDISK = raw, physical disk; Capacity will be N/A for RDISKs VDISK = virtual disk |
Capacity | The storage potential of the virtual disk |
Datastore | The datastore to which the virtual disk belongs |
LUN | The LUN on which the virtual disk’s storage is located |
Array | Array in which the disk resides |
Mode | 1 = Persistent - immediate, permanent changes 2 = Non-persistent - changes do not persist once VM is powered off 3 = Undoable - user determines how and when changes are saved 4 = Append - changes appended to a log when VM is powered off |


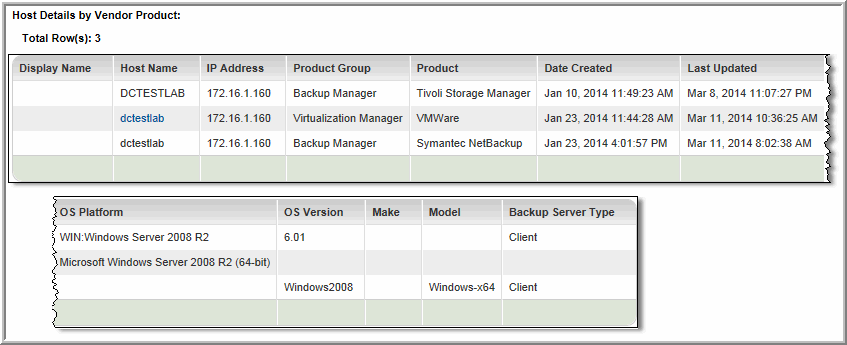
Display Name | Name that is displayed in reports. |
Host Name | Name of the host as it was collected by the vendor product. |
IP Address | IP address of the host. |
Product Group | The APTARE StorageConsole group, such as Capacity Manager, for which the host data was collected. |
Product | A specific vendor product (subsystem) from which host data was collected; for example, VMware. |
Date Created | The date and time the host was created in the StorageConsole database. |
Last Updated | The date and time the host data was updated in the StorageConsole database. |
OS Platform | Operating system of the host, as collected from this vendor product; for example, Windows Server 2008 R2. |
OS Version | The host’s specific operating system version, as collected from this vendor product; for example, 6.01. |
Make | The host’s make, as collected from this vendor product; for example,Windows-x64. |
Model | The host’s model, as collected from this vendor product; for example, PowerEdge 2950. |
Backup Server Type | The host’s role in a backup relationship, client or server. |