VM Server Detail
Detail reports are related to a specific enterprise object, such as a backup job or SAN fabric. You can only access detail reports through a link presented in the context of a main report, providing additional information that augments the main report. Detail reports cannot be generated, customized, or saved, as they are specific to the report from which they were derived. Therefore, they will not be available in search results.
Use Quick search to find the main template, report or a dashboard by name. Search is case insensitive, supports partial entries, and will display a list of potential matches.
As you enter the template, dashboard or report name in the Quick Search field, up to 10 potential matches are displayed. If the result is shown, you can select and run it directly from the match list. You can also select All Items to display the full search results page and further filter your results.
You can use the Explorer tab to browse through the StorageConsole templates, dashboards and reports. The navigation pane displays templates organized by products along with user created, and system folders. The main report is located here:
Virtualization Manager > Administration Reports > VM Server Summary
Click the Name link.
NOTE: VMTools must be installed to enable collection of the IP address, Host name, mount points, and guest operating system of the VM.
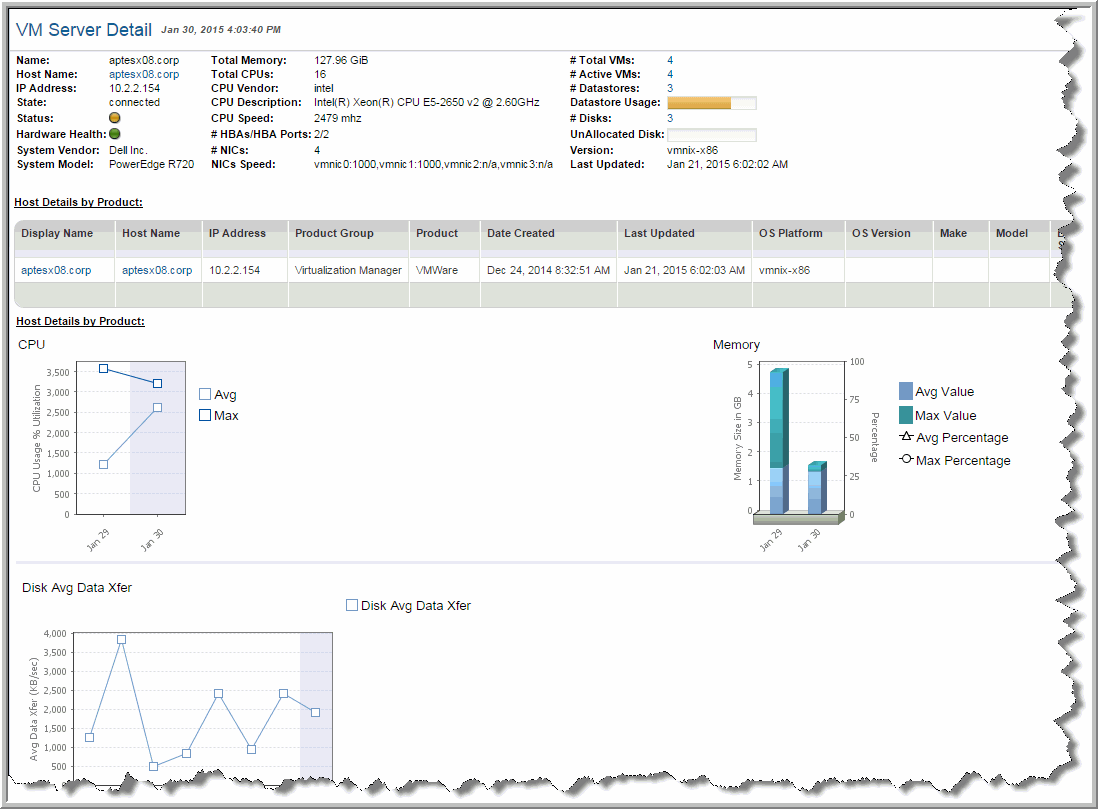
VM Server Detail Data
Name | Name of the VM Server that is hosting the virtual server; for example, the ESX host |
Host Name | Hostname of the guest; value is displayed only if VMTools is installed; links to Host Details |
IP Address | IP address of the Virtual Machine; value is displayed only if VMTools is installed |
State | Network adapter connection state: Connected, Not Responding, Disconnected, None |
Status | Gray=Status Unknown, Green=Normal, Yellow=Warning, Red=Alert, a definite problem |
Hardware Health | Indicates the overall health of the host’s hardware: None, Unknown, Green=Normal, Yellow=Warning, Red=Alert |
System Vendor | Host vendor |
System Model | Model of the host system |
Total Memory | Total memory available as a resource to the VMs on this host |
Total CPU | Total CPU available as a resource to the VMs on this host |
CPU Vendor | Processor’s vendor |
CPU Description | Type of processor |
CPU Speed | Processor speed |
# HBAs/Ports | Number of host bus adapters and ports on the VM Server |
# NICs | Number of physical network interface cards |
NIC Speed | Speed of the interface cards |
# Total VMs | Number of VMs configured on this host and in the inventory |
# Active VMs | A VM is active when it is in the inventory and powered on; it is inactive if it is in the inventory, but powered off. |
# Datastores | Number of datastores that this VM Server is using |
Datastore Usage | Amount of storage in the datastore that this VM Server is using |
# Disks | The number of disks that the VM Server can access, either internal disks or LUNs. Drill down to the Datastore Utilization Summary. |
Unallocated Disk | Mouse over the thermometer bar to view the total disk capacity, the amount used, and the % of the total used. Drill down to the Datastore Utilization Summary. |
Version | Version of the virtual server software, such as ESX |
Last Updated | Timestamp of last data collection |
Performance & Forecast
CPU | Average and Maximum usage graphed over time for the number of samples taken within that time frame. |
Largest VMs
Click the link to access the full list of the largest VMs, listed in descending order, with the top storage-consuming VMs at the top of the list.
NOTE: VMTools must be installed to enable collection of the IP address, Host name, mount points, and guest operating system of the VM.
For a description of these fields, see
VM Summary.
Datastores
For a description of the fields in this table, see
Datastore Usage Breakdown.
Disks
These are the physical disks that are available to the VM Server.
For a description of the fields in this table, see
Datastore Utilization Summary.
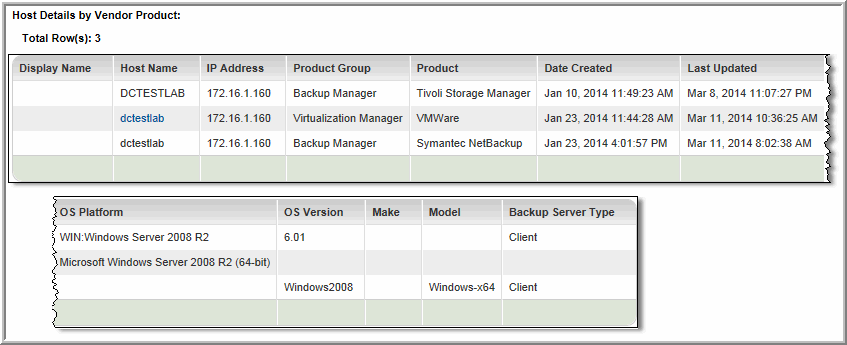
Host Details by Vendor Product
Hosts can be collected by any number of vendor products (subsystems), such as VMware, Symantec NetBackup, and EMC Symmetrix. This table lists the details that have been collected by a vendor product so that you can validate the collected details.
Display Name | Name that is displayed in reports. |
Host Name | Name of the host as it was collected by the vendor product. |
IP Address | IP address of the host. |
Product Group | The APTARE StorageConsole group, such as Capacity Manager, for which the host data was collected. |
Product | A specific vendor product (subsystem) from which host data was collected; for example, VMware. |
Date Created | The date and time the host was created in the StorageConsole database. |
Last Updated | The date and time the host data was updated in the StorageConsole database. |
OS Platform | Operating system of the host, as collected from this vendor product; for example, Windows Server 2008 R2. |
OS Version | The host’s specific operating system version, as collected from this vendor product; for example, 6.01. |
Make | The host’s make, as collected from this vendor product; for example,Windows-x64. |
Model | The host’s model, as collected from this vendor product; for example, PowerEdge 2950. |
Backup Server Type | The host’s role in a backup relationship, client or server. |
Virtualization Manager Data Collection Options and VM Server Detail
If this report is accessed via a drilldown from another report, the values shown represent the type of data collection that was configured to collect this data.
A Virtualization Manager data collection policy can be configured to gather data as follows:
• Inventory (default option): Collect only the data associated with the VMs in the inventory.
• Collect all files in datastore: Perform a full scan of the datastore to discover files that are resident on the datastore, but not associated with a VM in the inventory. This option finds files that may be invisible to VMware, but that are consuming space on the datastore.
When the Inventory option is configured in the data collector policy, it has the following impact on fields shown in this report:
• VM Not In Inventory will be zero.
• Total VM Used will be reduced by the amount that would have been collected as VM Not In Inventory if an all files collection had been done.
When the Collect all files in datastore option is configured in the data collector policy, it has the following impact on fields shown in this report:
• The Last Modified date will be missing for files not found in the datastore scan.


