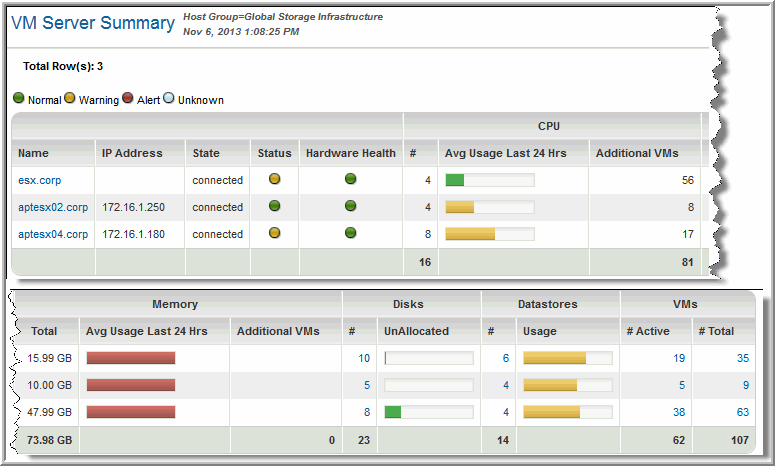

Name | Name of the VM Server that is hosting the virtual server; for example, the ESX host |
IP Address | IP address of the VM Server |
State | VM connection state: Connected, Not Responding, Disconnected, None |
Status | Gray=Status Unknown, Green=Normal, Yellow=Warning, Red=Alert, definite problem. When filtering the report on this field, use the color. |
Hardware Health | Indicates the overall health of the host’s hardware: None, Unknown, Green=Normal, Yellow=Warning, Red=Alert. When filtering the report on this field, use the color. |
# CPUs | Total number of processors in the virtual machine |
Avg CPU Usage Last 24 Hrs | The host’s average CPU usage for the past 24 hours for the number of samples taken within that time frame |
Additional VMs | Based on CPU resources, this value helps to determine how many more VMs can be supported on the VM server. |
Total Memory | Total memory capacity of the VM Server. |
Avg Mem Usage Last 24 Hrs | The VM Server’s average memory usage for the past 24 hours for the number of samples taken within that time frame |
Additional VMs | Based on memory resources, this value helps to determine how many more VMs can be supported on the VM server. |
# Disks | The number of disks that the VM Server can access, either internal disks or LUNs. Drill down to the Datastore Utilization Summary. Note that the disks are specific to the VM server, whereas the Datastore utilization may be using both VM Server disks and disks apart from the VM Server disks. |
Unallocated | Amount of disk space that is unallocated. Mouse over this thermometer to view the total, unallocated, and percentage unallocated. Click on this thermometer to view the Datastore Utilization Summary. |
# Datastores | The number of datastores provisioned to the VM Server; drill down to the Datastore Usage Breakdown report |
Datastore Usage | Mouse over the thermometer bar to view the total datastore capacity, the amount used, and the % of the total used. Drill down to the Datastore Capacity Forecast. |
# Active VMs | A VM is active when it is powered on. An inactive VM is in the inventory, but is powered off. This column shows the number of active VMs. Drill down to the VM Summary. |
# Total VMs | The total number of VMs in the inventory, both active and inactive. Drill down to the VM Summary. |