NetApp Aggregate Summary
Detail reports are related to a specific enterprise object, such as a backup job or SAN fabric. You can only access detail reports through a link presented in the context of a main report, providing additional information that augments the main report. Detail reports cannot be generated, customized, or saved, as they are specific to the report from which they were derived. Therefore, they will not be available in search results.
Use Quick search to find the main template, report or a dashboard by name. Search is case insensitive, supports partial entries, and will display a list of potential matches.
As you enter the template, dashboard or report name in the Quick Search field, up to 10 potential matches are displayed. If the result is shown, you can select and run it directly from the match list. You can also select All Items to display the full search results page and further filter your results.
You can use the Explorer tab to browse through the StorageConsole templates, dashboards and reports. The navigation pane displays templates organized by products along with user created, and system folders. The main report is located here:
Capacity Manager > Array Capacity & Utilization > NetApp Aggregate Summary
or
Capacity Manager > Array Capacity & Utilization > Array Capacity & Utilization
Next, click # Aggregates.
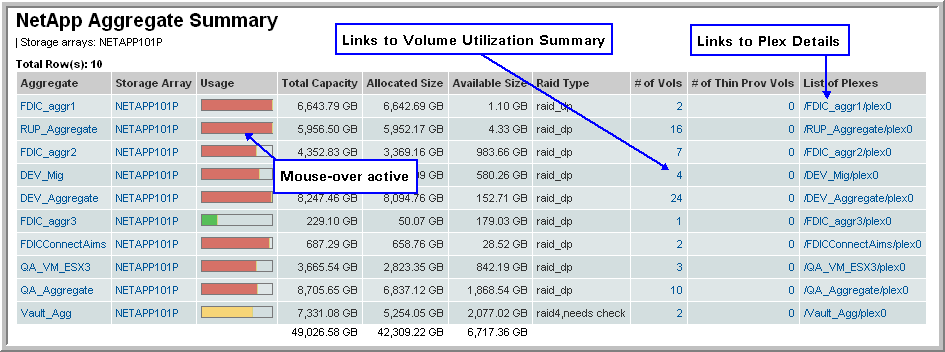
View this report for an overview of how your aggregates are configured to manage disks, RAID groups, and Plexes. The Aggregate Utilization Summary displays one row for each aggregate, with links to Volume and Plex details.
NOTE: If the aggregate is mirrored, two Plexes will be listed.
Aggregate | The Aggregate number/ID |
Storage Array | The NetApp system with which the aggregate is associated |
Usage | Mouse over the usage thermometer to view the % available |
Total Capacity | The aggregate’s total capacity |
Allocated Size | Amount of capacity that has been allocated for use |
Available Size | Remaining capacity available for use |
RAID Type | raid0 (mirrored), raid4 (single disk for parity), or raid_dp (double-parity protection) |
# Volumes | |
# of Thin Prov Vols | Number of thin provisioned volumes |
List of Plexes | Lists 1 or 2 Plexes—2 if SyncMirror is licensed and enabled. Links to the NetApp Plex Details report. |
In addition, the following Disk Type information is displayed:
Raid Status | RAID status |
Count | Number of disks |
Total Capacity | Total capacity of the disks |

