Format the Output
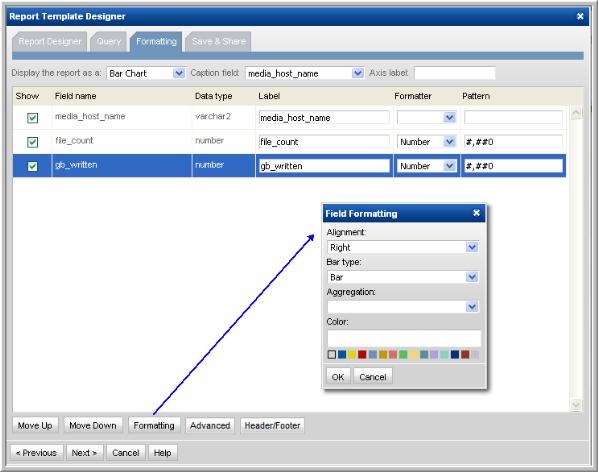
1. From the Formatting tab, specify the following:
• Output style—Display the report as: Table, Bar Chart, Pie Chart, or Pivot Table.
When formatting a Pivot Table, only three fields are used (x, y, and a value). Use the Move Up and Move Down feature to position the fields to easily select three fields.
• Fields from the query that you want to include in the report. Select the checkbox of the query field to indicate the fields to be displayed.
• Select the Display Field and click Formatting (at the bottom of the window) to view the formatting options.
• Label—You can re-label the displayed fields to something more relevant to your needs.
• Data alignment—Left, Center, or Right.
• Aggregation: Sum, Average, Minimum, Maximum
• Number, Size, and Date and Time patterns.These patterns are based on the Java classes SimpleDataFormat and NumberFormat.
• Type: Pie Chart—If you are formatting a Pie Chart, select a character field from the
Caption field drop-down list. The field formatter will show a
Type parameter. For pie charts, use numeric fields as pie chart segments. See
Example of a Pie Chart for Job Size by Job Type.
2. At the bottom of the Formatting window, use the Move Up and Move Down buttons to organize the fields in the order that you want them to appear in a tabular report. Be sure to select a row before shifting the fields.
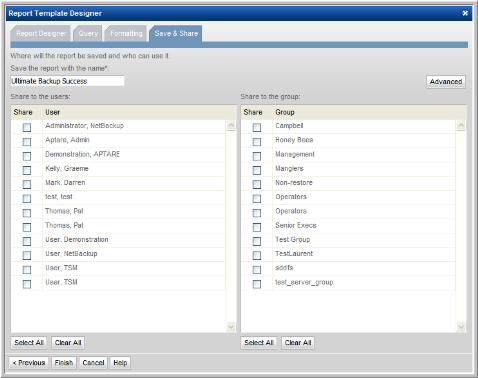
3. In the Save & Share window, complete the appropriate text boxes to save and share the report, then click OK. You can choose one or more users and user groups. The saved report template will be listed in the report group that you select.
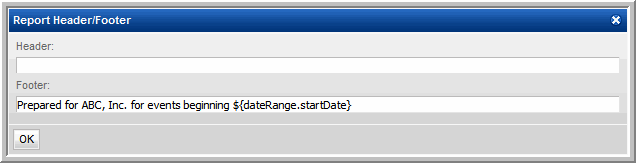
Configuring a Header and Footer in a Custom Report Template
At the bottom of the Formatting window in the SQL Template Designer, click the Header/Footer button to launch the window where you can define the text and variables that will be displayed when the report is generated.
Any variables used in the query can be included in a header or footer, as shown in the above example.
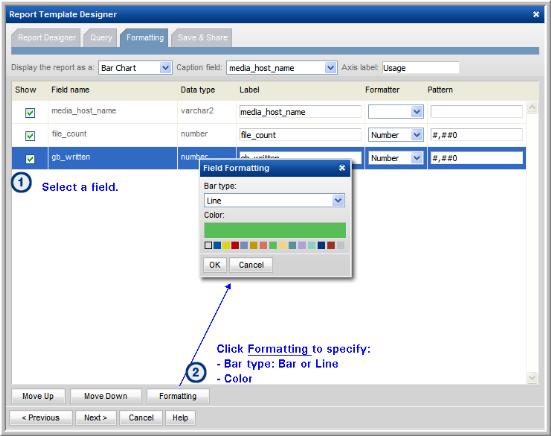
Formatting Example: Bar Chart
The following example illustrates how to create a Bar Chart and then format it with a dual axis.
1. From the Template Designer tabbed window, select Date Range and Host Groups and Client Scope.
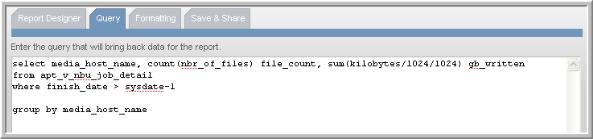
2. Create a query that has a field for the caption, each of the stacked bars, and the line.
3. In the Formatting tabbed section, select the data points and format each so that you have:
• 1 caption, n bars, and 1 line
Note: The line will be charted on the right-hand axis.
4. Set the color of the bars.
5. Specify the line formatting.
6. Save the report to the My Reports report menu group. Then, click on the saved report to generate it.
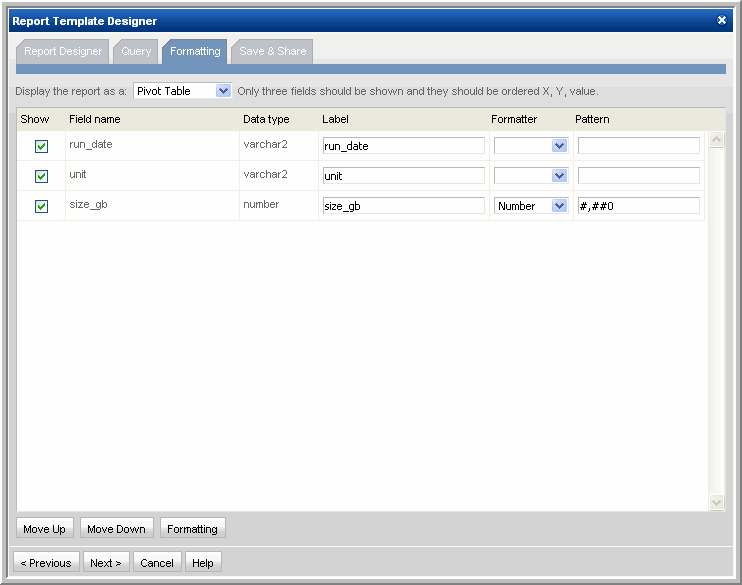
Formatting Example: Pivot Table
The following example illustrates a key SQL Template Designer formatting feature—Pivot Tables. A pivot table provides a useful mechanism for aggregating and summarizing data. In effect, you are taking the flat rows of data and grouping them into a multi-dimensional representation of the data, enabling easier data analysis. When you format this report, you can have only 3 fields of data, which will be represented in the table as the row, column, and data.
When formatting a Pivot Table, only three fields are used (x, y, and a value). Use the Move Up and Move Down feature to position the fields to easily select three fields.
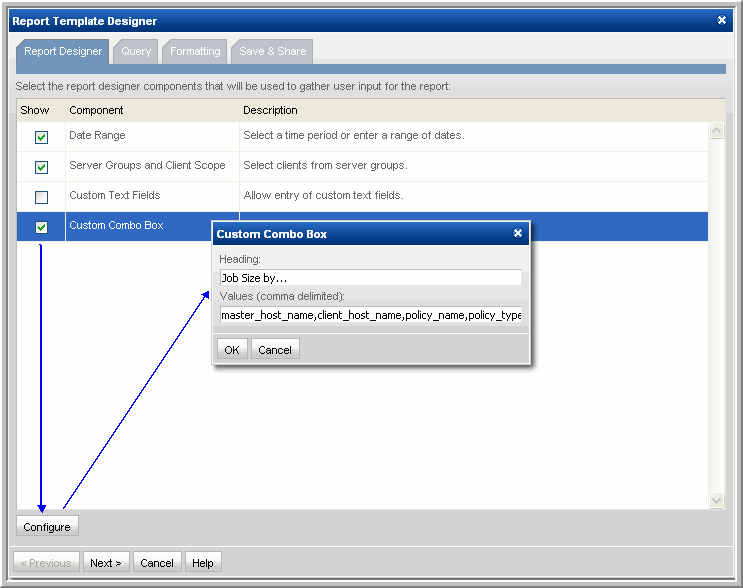
1. From the Template Designer tabbed window, select Date Range and Host Groups and Client Scope and also Custom Combo Box.
2. Select Custom Combo Box and click Configure at the bottom of the Query window.
3. Enter the heading for the drop-down combo box—in this example, Job Size by...
4. Enter the following comma-separated list of values and then click OK: master_host_name, client_host_name, policy_name, policy_type_name, schedule_name, schedule_type_name, storage_unit_label
These will be the options that a user can select when generating a report.
5. Click on the Query tab and enter the following query:
SELECT to_char(start_date,'MM/DD/YY') run_date, to_char(${freeCombo}) unit, trunc(sum(kilobytes/1024/1024)) size_gb
FROM apt_v_nbu_job_detail
WHERE start_date BETWEEN ${startDate} AND ${endDate}
AND client_id in (${hosts})
GROUP BY to_char(start_date,'MM/DD/YY'), ${freeCombo}
6. Click Validate Query and then Next.
7. In the Formatting window, select all three fields: run_date, unit, and size_gb
8. Save the report to a report menu group. Then, click on the saved report to generate it.