 |
Report | Description |
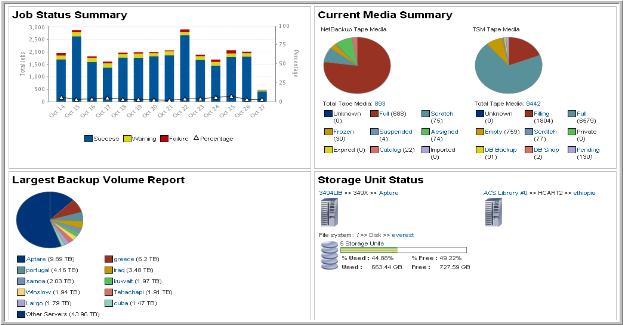
Job Status Summary | Displays the number of successful, warning and error events for each time period. The dashed yellow line displays the SLA success goal while the triangle symbols track actual achievement for each day. Clicking on any of the bars will take you to the Job Summary Report for the corresponding event status and time frame. |
Current Media Summary | Provides a real-time snapshot of all the media utilized by the servers within the report scope. Mouse‑over any of the pie-chart sections to display pop-ups that provide pertinent details about the media of the corresponding status. Click on any section of the pie-chart or the to go to the Tape Media Summary report for all media with the corresponding status. Click on the Total Tape Media link to go to the Tape Media Summary report for all the servers within the report scope. |
Largest Backup Volume Report | Provides a real-time snapshot of the largest server backup consumers within the report scope. Mouse‑over any of the bars or symbols on the chart to display pop-ups that provide details. Click on any section of the pie-chart to go to the Server Consumption Summary Report for a particular server. Click on the Total Servers link to go to the Server Consumption Summary report for all the servers within the report scope. |
Storage Unit Status | Each file system is identified by the file system path, with its management server displayed above the file system graphic. The total number of Storage Units sharing the same file system is also shown. The display of this report is dependent on the backup products in your environment and the report scope. Each file system is accompanied by a thermometer, which indicates the percentage of space occupied and available on the file system. The Used value is as reported by the operating system, and includes space occupied by all backup images as well as any other files that may reside on that file system. The Free value also is reported by the operating system. Used and free values of Unknown indicate the Discovery module has not been configured to probe the media servers’ file systems for their physical characteristics. |