Mission Control - Backup
Use Quick Search to find a template, report or dashboard by name. Search is case insensitive, supports partial entries, and will display a list of potential matches.
As you enter the name in the Quick Search field, up to 10 potential matches are displayed. If the template, report or dashboard is shown, you can select and run it directly from the match list. You can also click All Items in the match list to go directly to the Search Results.
Use the Explorer to browse through the StorageConsole templates, dashboards and reports. The navigation pane displays templates organized by products along with user created, and system folders. This report is located here:
Backup Manager > Administration Reports > Mission Control - Backup
The Mission Control report provides you with a comprehensive snapshot of your backup and restore event status. Using this report, you can easily identify hosts that have had no backups or failed backups. And, you can drill down to ascertain the root cause of unsuccessful backups. Organizations use this report to ensure Sarbanes-Oxley compliance, as it shows ultimate backup success over time.
When you generate this report, the Report Designer prompts you to select scope parameters, including the options to:
• Ignore Retries
• Exclude Clients with Successful Backups
• Exclude Clients with no Backups - Only clients with at least one “No Jobs” or “Failed” indicator will be shown. Note that if the last column corresponds to the current day and the indicator is “No Jobs” and all other indicators for the row are successful, the row will be considered a “success” and therefore will be excluded from the report.
• Include Master Servers - Report on Master Servers rather than clients. For example, if a client is backed up by two Master Servers, you can avoid having duplicate jobs in the list.
NOTE: A row can be expanded to list underlying details for NetBackup, EMC Networker, and HP Data Protector servers. For Tivoli Storage Manager and Backup Exec, an expansion arrow will not be available. Also, the Flashback policy type (used for VM backups) is not supported; however, an expansion arrow may be displayed, with no underlying details available.
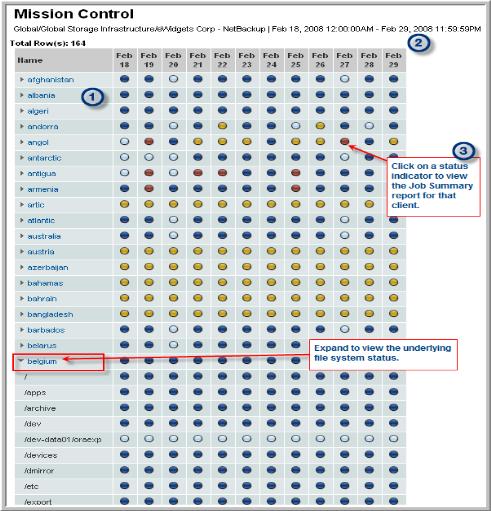
Event Status | Displays a row for each server within the report scope. Click on any server name in the list to go to the Host Details page for that server. Some servers will have an arrow next to it, which can be used to expand the server to show the underlying file systems. |
Current Date Range | The date range that is currently displayed in the report is always listed at the top of the report. If the date range is beyond the current day, or before your backup environment data started being pushed to the Reporting Database, the event indicator will be “No Jobs.” |
Status Indicators | Each day column for every server contains an event status indicator with the following color codes. The indicator always reflects the most serious status if there is more than one event for that server on that day. For example, if there are three successful events and one failure, the indicator will be red.  Click on any of the indicators to go to the Job Summary Report for all events associated with that server on that day. Once in the Job Summary Report, you can drill down to Job Details and even add a note to indicate the strategy for resolving an issue—thus, providing an audit trail. |
Tailoring the Report Output by Backup Product
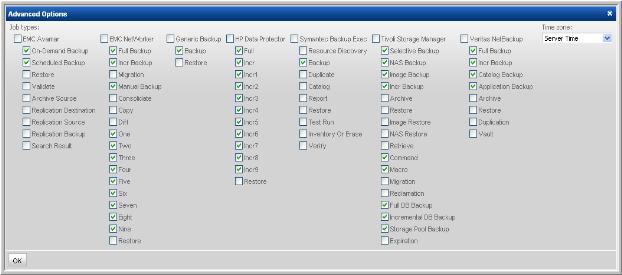
In the scope selector, click
Advanced.

Note that the options available in this window depend on the backup product data collection options that have been enabled for your Portal.


