Array Performance by RAID Group
Use Quick Search to find a template, report or dashboard by name. Search is case insensitive, supports partial entries, and will display a list of potential matches.
As you enter the name in the Quick Search field, up to 10 potential matches are displayed. If the template, report or dashboard is shown, you can select and run it directly from the match list. You can also click All Items in the match list to go directly to the Search Results.
Use the Explorer to browse through the StorageConsole templates, dashboards and reports. The navigation pane displays templates organized by products along with user created, and system folders. This report is located here:
Capacity Manager > Storage Performance > Array Performance by RAID Group
Note that the sub-total line, beneath a storage array’s RAID group list, displays averages for the Read Resp and Write Resp columns.
For a list of Array Families, collected performance statistics, and details on how performance profiles are determined, see APTARE StorageConsole Certified Configurations Guide.
NOTE: For CLARiiON arrays, a LUN that is assigned to a Pool (as is required for dynamic provisioning) will not have any performance statistics collected.
NOTE: HP 3PAR arrays are represented uniquely with each Common Provisioning Group (CPG) represented as a RAID Group. Virtual volumes (VV) can be allocated directly, outside of a CPG with each VV being represented as an individual RAID Group.
Storage Array | Array name |
RAID Group | RAID group name |
Performance | Either Fast, Normal, or Slow, based on the performance index calculation for the LUN using the last baseline profile ranges for Fast and Slow performance; takes into account the worst performance of a LUN in the RAID Group. Each of these performance states are represented by a colored dot as shown in the legend at the top of the report. |
RAID Type | RAID type |
Drive Type | Drive type, such as SAS or SATA |
Drive Speed | Drive speed in RPM |
Drive Form | Drive enclosure |
# LUNs | # of LUNs with drilldown to Array Performance by LUN. You can also click the LUN name to show the LUN Details report. |
Total Response (ms) | Total I/O response time = the average response time for all read and write operations (total I/Os) |
Response Time Read (ms) | Average response time (for the LUNs in the RAID Group) during the specified interval in milliseconds |
Response Time Write (ms) | Average response time (for the LUNs in the RAID Group) during the specified interval in milliseconds |
Throughput Total IO/sec | Read IOs/sec + Write IOs/sec |
Throughput Read IO/sec | Total Read IOs for interval/length of interval in seconds |
Throughput Write IO/sec | Total Write IOs for interval/length of interval in seconds |
Transfer Rate Read MB/sec | Total megabytes transferred for the interval/length of interval in milliseconds |
Transfer Rate Write MB/sec | Total megabytes transferred for the interval/length of interval in milliseconds |
Cache Hits/sec Read | Total Read Hits for interval/length of interval in seconds |
Cache Hits/sec Write | Total Write Hits for interval/length of interval in seconds |
Array Performance by LUN
Detail reports are related to a specific enterprise object, such as a backup job or SAN fabric. You can only access detail reports through a link presented in the context of a main report, providing additional information that augments the main report. Detail reports cannot be generated, customized, or saved, as they are specific to the report from which they were derived. Therefore, they will not be available in search results.
Use Quick Search to find the main template, report or a dashboard by name. Search is case insensitive, supports partial entries, and will display a list of potential matches.
As you enter the template, dashboard or report name in the Quick Search field, up to 10 potential matches are displayed. If the result is shown, you can select and run it directly from the match list. You can also select All Items to display the full search results page and further filter your results.
You can use the Explorer to browse through the StorageConsole templates, dashboards and reports. The navigation pane displays templates organized by products along with user created, and system folders. The main report is located here:
Capacity Manager > Storage Performance > Array Performance by RAID Group
• Click # of LUNs.
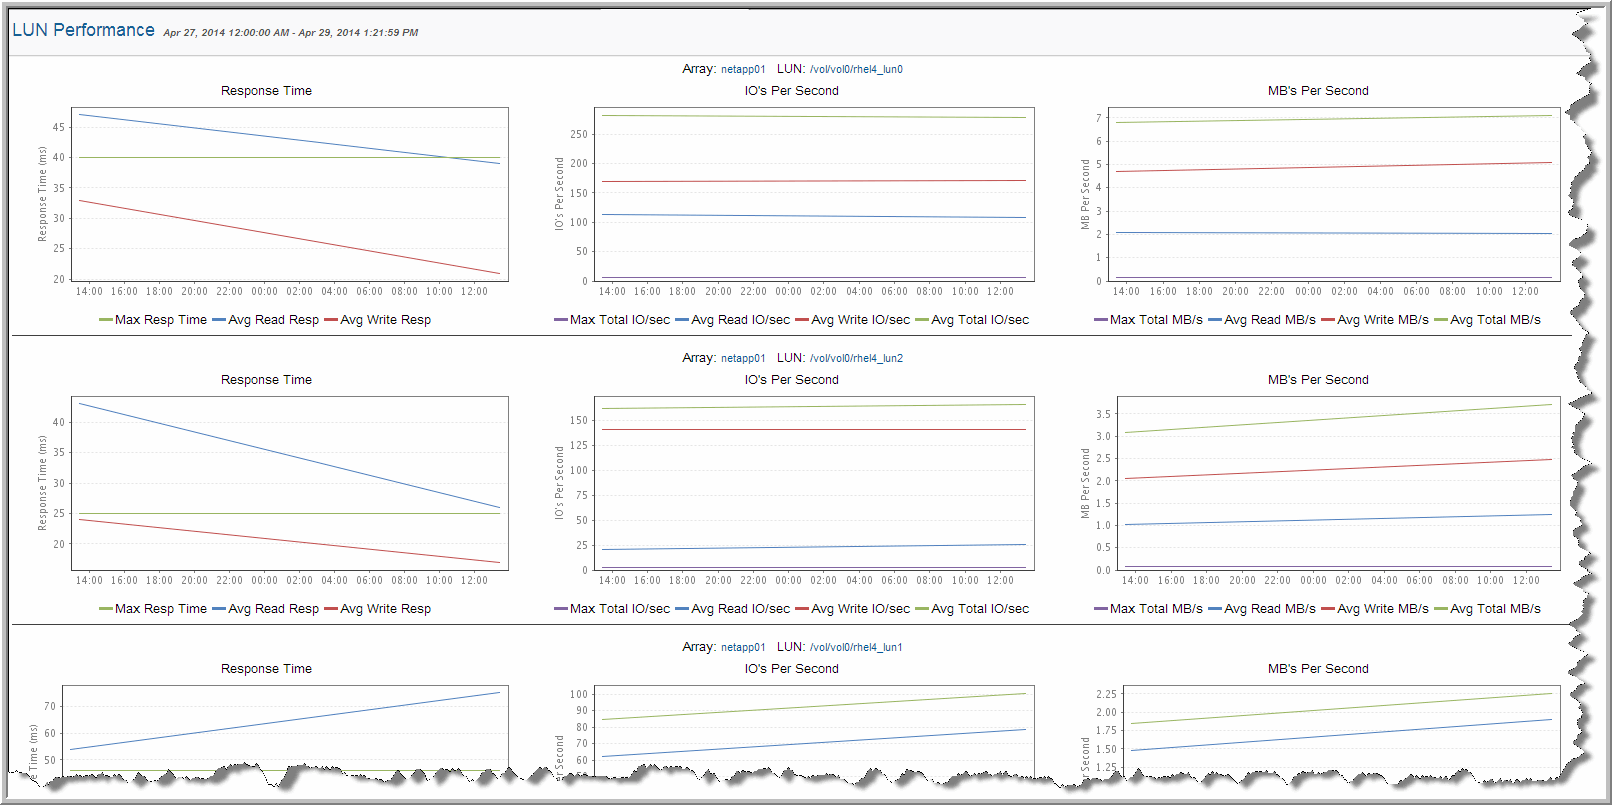
• Select a row and click the Show Chart button to display the LUN Performance report. This shows performance charts as a time series. Roll-over the chart to show date and time. Select multiple rows to compare performance charts of individual LUNs.
• Click
LUN to display the
LUN Details report to show performance graphs and LUN attributes. See
LUN Details.
Storage Array | Array name |
RAID Group | RAID group name |
Performance | Either Fast, Normal, or Slow, based on the performance index calculation for the LUN using the last baseline profile ranges for Fast and Slow performance; takes into account the worst performance of a LUN in the RAID Group. Each of these performance states are represented by a colored dot as shown in the legend at the top of the report. |
LUN | LUN name. Click the LUN name to launch the LUN Details report. |
RAID Type | RAID type |
Drive Type | Drive type, such as SAS or SATA |
Drive Speed | Drive speed in RPM |
Hosts | The name of the host to which storage from the LUN was allocated. |
Response Time Read (ms) | Average response time (for the LUNs in the RAID Group) during the specified interval in milliseconds |
Response Time Write (ms) | Average response time (for the LUNs in the RAID Group) during the specified interval in milliseconds |
Throughput IO/sec Total | Read IOs/sec + Write IOs/sec = Throughput Total. |
Throughput IO/sec Read | Total Read IOs for interval/length of interval in seconds |
Throughput IO/sec Write | Total Write IOs for interval/length of interval in seconds |
Transfer MB/sec Read | Total megabytes transferred for the interval/length of interval in milliseconds |
Transfer MB/sec Write | Total megabytes transferred for the interval/length of interval in milliseconds |
Cache Hits/sec Read | Total Read Hits for interval/length of interval in seconds |
Cache Hits/sec Write | Total Write Hits for interval/length of interval in seconds |
Show Chart | After selecting a row, click the Show Chart button to display a time series chart. Roll-over the chart to show date and time. You can select multiple rows to show the LUN Performance of multiple LUNs and compare them side-by-side. See LUN Performance. |
LUN Performance
Detail reports are related to a specific enterprise object, such as a backup job or SAN fabric. You can only access detail reports through a link presented in the context of a main report, providing additional information that augments the main report. Detail reports cannot be generated, customized, or saved, as they are specific to the report from which they were derived. Therefore, they will not be available in search results.
Use Quick Search to find the main template, report or a dashboard by name. Search is case insensitive, supports partial entries, and will display a list of potential matches.
As you enter the template, dashboard or report name in the Quick Search field, up to 10 potential matches are displayed. If the result is shown, you can select and run it directly from the match list. You can also select All Items to display the full search results page and further filter your results.
You can use the Explorer to browse through the StorageConsole templates, dashboards and reports. The navigation pane displays templates organized by products along with user created, and system folders. The main report is located here:
Capacity Manager > Storage Performance > Array Performance by RAID Group
1. Click # LUNs. The Array Performance by LUN report is displayed.
2. Select multiple rows to compare performance charts of individual LUNs. Click the
Show Chart button to display the
LUN Performance report. This shows performance charts as a time series. Roll-over the chart to show date and time.

LUN Details
Detail reports are related to a specific enterprise object, such as a backup job or SAN fabric. You can only access detail reports through a link presented in the context of a main report, providing additional information that augments the main report. Detail reports cannot be generated, customized, or saved, as they are specific to the report from which they were derived. Therefore, they will not be available in search results.
Use Quick Search to find the main template, report or a dashboard by name. Search is case insensitive, supports partial entries, and will display a list of potential matches.
As you enter the template, dashboard or report name in the Quick Search field, up to 10 potential matches are displayed. If the result is shown, you can select and run it directly from the match list. You can also select All Items to display the full search results page and further filter your results.
You can use the Explorer to browse through the StorageConsole templates, dashboards and reports. The navigation pane displays templates organized by products along with user created, and system folders. The main report is located here:
Capacity Manager > Storage Performance > Array Performance by RAID Group
• Click # of LUNs.
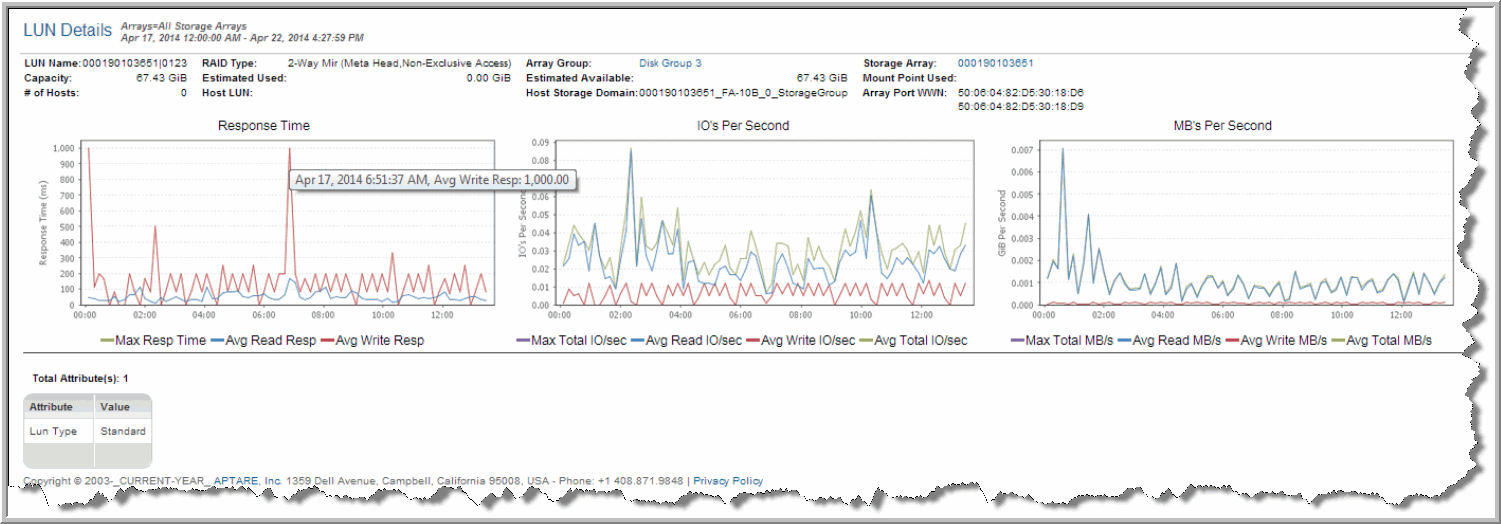
• Click LUN to display the LUN Details report to show performance graphs and LUN attributes for an individual LUN.
The LUN Details report is divided into three sections:
• LUN Summary
• Performance Graphs
• LUN Attributes


