Object Types | Use the drop-down list to specify the object types for the alerts. Use Ctrl+click to select multiple object types. |
Alert Rules | Choose to filter the results by the Alert Rule. Alert Rules are determined by your product installation. For example, if you do not have Backup Manager installed, the Alert Rules for backup are not displayed. |
Display | Choose the filter for the Alert Detail, show All alerts, Unsuppressed Only or Suppressed Only. |
Alert Status | Choose to filter the results by Alert Status. Select from Warning or Critical. |
Policy Name Filter | Enter a value to filter the results by Alert Policy Name. This field accepts wildcards (*). |
Group By | Use the drop-down list to specify how you want the data in the bar charts or tables to be grouped. The available options are dependent on the type of report. Some reports group by time, while others group data by accounts, EC2 instances, or S3 buckets. |
Time Period | The reporting time periods for this report. Your choices range from the last 5 minutes to the last 10 years. The options for this parameter depend on the report. For Backup Manager reports, the time period used to retrieve a report’s data takes into account the time zone of the collected systems, if relevant. For example, if 15 minutes is selected for a report that has a backup server in Hong Kong, but the report is being generated in San Francisco, the time period reflects the 15-minute interval and the end time will be the end of the Hong Kong server’s day. If there is no data collected from a different time zone, the Portal’s local time is used. |
Start Date / End Date | If you want a static report, specify a start and end date in the date format: MM/DD/YYYY. If you want a dynamic report—that is, a report that changes as the underlying data changes—do not specify a start and end date, as the default always represents the current day. |
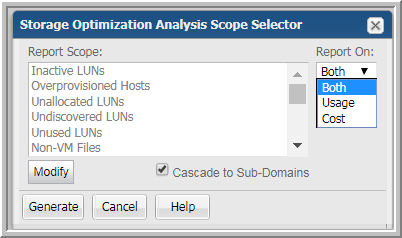
Hosts | Use this filter to specify what data will be included in a report. • Host Group. Includes data from default and user‑defined host groups. • Attribute. Includes data from default, system and user‑defined attributes or characteristics. • Hosts. Includes data for only specific hosts rather than data for host groups. See also
Report Scope. |
Group By | Use the drop-down list to specify how you want the data in the bar charts or tables to be grouped. The available options are dependent on the type of report. Some reports group by time, while others group data by either host, client, or policy. |
Parent/Child Jobs | Select from Parent, Child or Both. If a parent-child relationship exists, you can select to append Backup Manager job details with the details of parent or child jobs. |
Event Type | Job types: • All Backup & Restore Events • All Backup Events • Full Backups • Incremental Backups • Restores • Unknown Events |
Show Capacity in | Select the unit value to display the capacity in. Choose Dynamic to allow for the dynamic calculation of the units in the report based on size. If you choose Dynamic as an option and run the report, the data value will be displayed as follows: • If the value in the report is greater than say 1024MB then show in GB • If the value is greater than 1024 GB show TB |
Media Status | The Media Status parameter is included in the Tape Media Summary Scope Selector. You can specify which media should be included in the report by selecting one of the following options: All Media, Expired Media, Available Media, In Use Media or Full Media. The default setting for this parameter is All Media. |
Job Status | Applies to all backup event‑driven reports. Select from the following event status options: • All Events • Successful Events • Warning Events • Successful or Warning Events • Failed Events |
Backup Window | Select a custom backup window to be applied to the report. Typically, backups begin at the end of the business day, but they do not finish before the end of the day—thereby skewing the success statistics for the day. To more accurately reflect backup SLA metrics, you can re-define a day with a custom backup window. These custom backup windows are defined by the APTARE IT Analytics Application Administrator. To create specific backup windows, see
About Custom Backup Windows. |
Backup Policy Name Filter | This filter appears in the Job Summary and Job Volume Summary scope selectors. Enter a backup policy name to filter the report output by backup policy. This enables analysis of job status for a specific policy. |
# of Consecutive Errors | Use this filter to exclude consecutive errors. This option comes in handy when troubleshooting by limiting the report to hosts with excessive activity. Select a number from the drop-down list. Only sets of consecutive errors >= the specified number will be included in the report. |
Dynamic Report Start & End Times | Provides the user with the ability to specify dynamic report start and end day and time. Simply specify the number of days before or after the current day as well as the time for both the start and end day and times to be used to generate the report. |
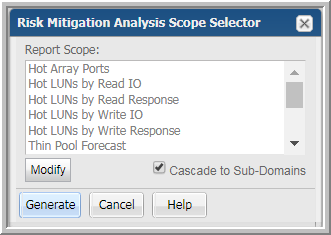
Cascade into sub-groups | The scope selector default is to cascade to all child sub-groups when generating the report. If you prefer to report ONLY on the host group you selected, then uncheck Cascade into sub-groups. |
Start Time / Finish Time | Specify the backup/restore event start or finish time to be used when culling the events within the time frame for the report. For example, if you only want to display events that occurred between 12AM and 6:30AM, then specify those times for the start and finish time parameters so that the application filters the events by those time constraints. Available in various backup/restore events reports. |
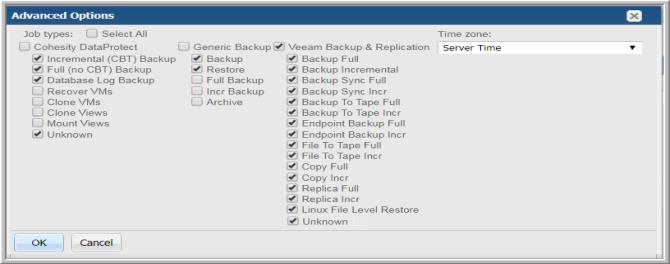
Time Zone | Enables you to select a specific time zone to normalize the report by any time zone. The default setting for this parameter is the time zone setting of the Management Server. |
Error Code Excludes | Check the Set Error Excludes box and the application will dynamically generate an Error Code ID/Descriptions Dialogue where you can check all the error codes that need to be excluded from the report. Then, click Accept and all the codes will auto‑populate the Exclude Id text box. Any event which existed with an error code specified in the exclude list will not be included in the resulting report. This functionality currently is available only for the Consecutive Errors By Client Report. |
Ignore Retries | Check this box to indicate that retries for backup jobs should not be incorporated in the statistics shown. |
Job Types | Refers to the type of backup job. Each backup product has its own set of job types. The list represents the products for which data collection has been licensed for your Portal. Check the job types to be included in the report output. |
Storage Arrays | Lists all storage arrays that the APTARE Data Collectors identified. Expanding the top-level folder enables access to other folders for: • All Storage Arrays • Storage Array Vendors • Attributes |
Hosts | Use this filter to specify what data will be included in a report. • Host Group. Includes data from default and user‑defined host groups. • Attribute. Includes data from system and user‑defined attributes. |
Host Type | Indicates how a host has been commissioned in an enterprise, such as VM Guest, VM Server, VIO Guest, VIO Server, or Other. This selection enables reporting of various types of virtual hosts. |
Start Date / End Date | If you want a static report, specify a start and end date in the date format: MM/DD/YYYY. If you want a dynamic report—that is, a report that changes as the underlying data changes—do not specify a start and end date, as the default always represents the current day. |
Threshold | For Capacity At Risk reports only, limit the report output to a threshold category: • Low • Warning • Critical |
Group By | Use the drop-down list to specify how you want the data in the bar charts or tables to be grouped. The available options are dependent on the type of report. Some reports group by time, while others group data by either host, client, or policy. |
Cascade into sub-groups | The scope selector default is to cascade to all child sub-groups when generating the report. If you prefer to report ONLY on the host group you selected, then uncheck Cascade into sub-groups. |
Hosts | Specify hosts to be included in the report scope. |
Backup Server Type | The type of host in a backup environment, such as Client or Media Server. |
Domain | The domain to which the enterprise object belongs. |
External Name | Name of the host that will appear in reports. |
Group By | Provides a drop-down list to specify how the data in the charts or tables will be grouped. The available options are dependent on the type of report. Some reports group by time, while others group by either host, server, client, or policy. |
Host | Name of the host, as defined in the collected product. |
Host Type | Indicates how a host has been commissioned in an enterprise, such as VM Guest, VM Server, VIO Guest, VIO Server, Oracle Container, Oracle Zone, Hyper-V Server, Hyper-Guest, or Other. This selection enables reporting of various types of virtual hosts. |
Make | Make of the host, such as Dell. |
Maximum legends for Pie Chart | Specify the maximum number of slices for pie chart rendering. |
Model | Model of the host, such as Windows-x86. |
OS Platform | Host’s OS type, such as Linux or Windows. |
OS Version | Version of the host’s operating system. |
Product Collected | Find hosts that have been collected from particular subsystem, such as Veritas NetBackup. |
Product Group Collected | Find hosts that have been collected by this product group, such as capacity collection. |
Product Group Not Collected | Find hosts that have not been collected by this product group, such as capacity collection. |
Product Not Collected | Find hosts that have not been from particular subsystem, such as Veritas NetBackup. |
SAN-attached hosts only | Check this box if you want to see data for only SAN-attached hosts. When this box is not checked, the report will include VM Guests and hosts that have been collected by other APTARE IT Analytics products, such as Backup Manager or Virtualization Manager. |
Time Period | Provides a drop-down list to specify a time span, such as last 90 days or previous month. |
Time Period | The reporting time periods for this report. Your choices range from the last 5 minutes to the last 10 years. The options for this parameter depend on the report. |
Start Date / End Date | If you want a static report, specify a start and end date in the date format: MM/DD/YYYY. If you want a dynamic report—that is, a report that changes as the underlying data changes—do not specify a start and end date, as the default always represents the current day. |
Group By | Use the drop-down list to specify how you want the data in the bar charts or tables to be grouped. The available options are dependent on the type of report. Some reports group by time, while others group data by either host, client, or policy. |
Mask User Details | Choose Yes or No to mask user details. Default is Yes, so the report is in Summary mode. Detailed mode displays all user data. Summary mode masks user names and email addresses. |