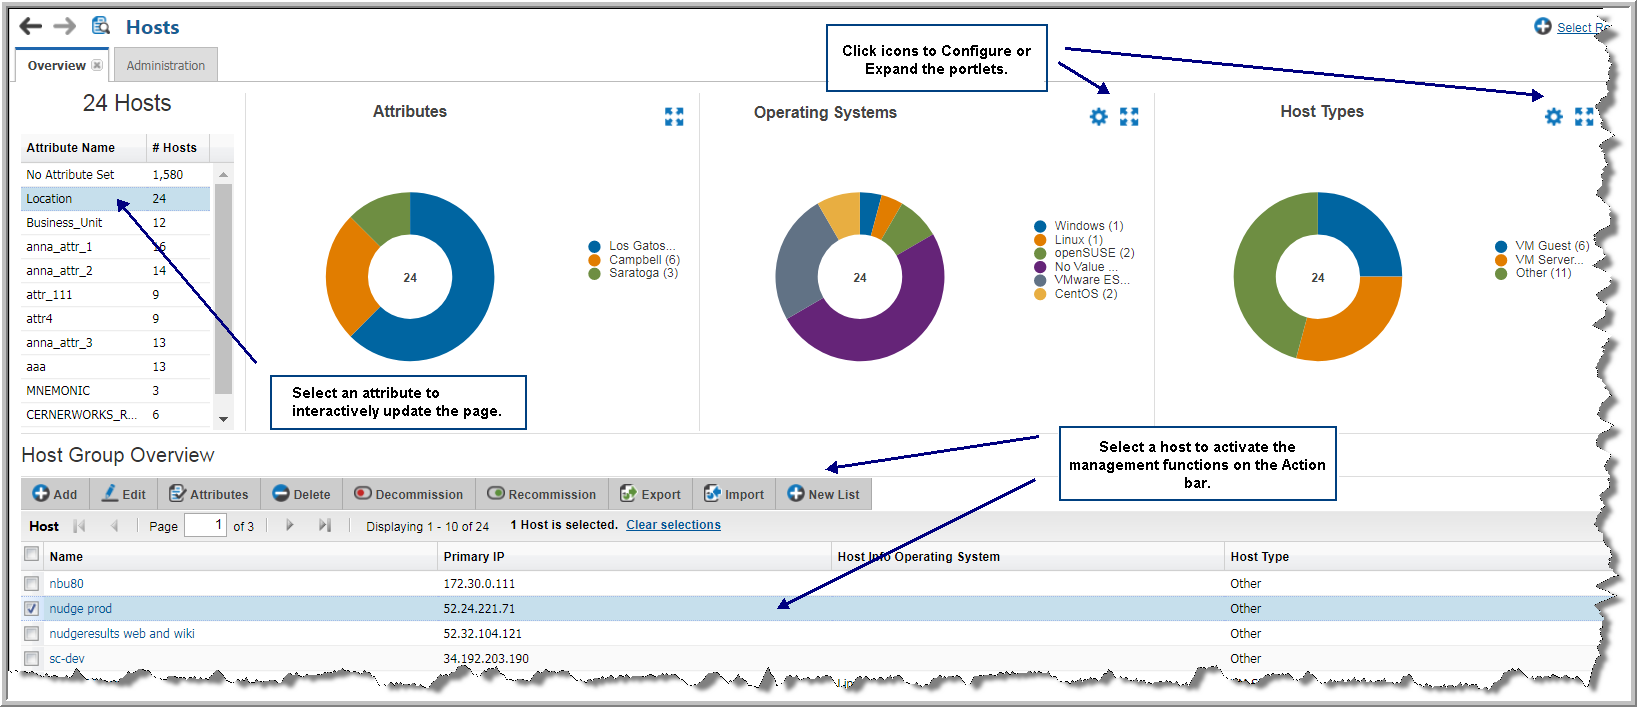
Host Group Overview
This overview page shows overview information for all collected Hosts in your data center visualized through the following default reports:
Values displayed in the following reports are controlled by the navigation table selection. When attributes are selected, pie charts and the corresponding tabular report are dynamically updated. You can also interactively configure the center and right pie charts by selecting available attributes using the
Configure Portlets icon.
Configuring Portlets
Attributes enable you to define a distinct data set based on a specific characteristic.You can quickly select additional attributes to change the display of the center and right pie charts giving you a custom view of your data.
1. Click the
Configure Portlet icon.
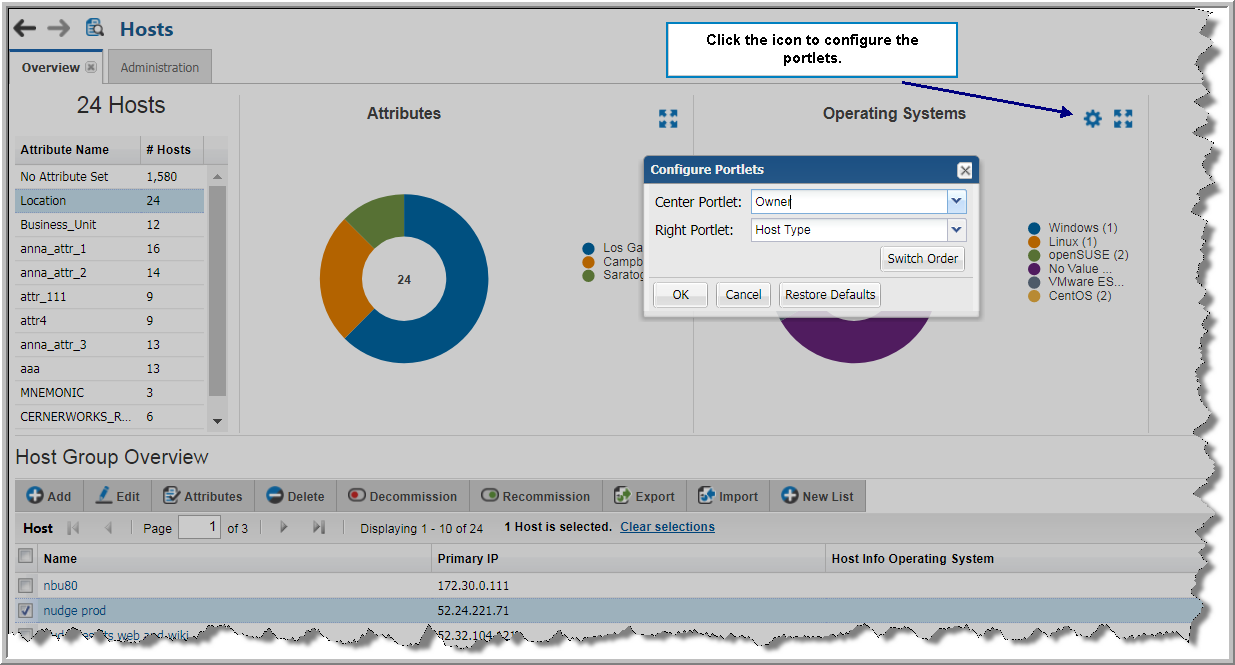
2. Choose an attribute. You can select one attribute or choose one for each portlet.
3. Click Switch Order to change the portlet position. For example, you can move the center pie chart to the right. The right pie will move to the center.
4. Click OK to redraw the pie charts.
Attributes
Displays an interactive pie chart that visually depicts the attribute selection. For example, if you select Location and there are 21 hosts with that attribute, the pie chart shows the breakdown of the Locations by percentage. Click a sector to show the percentage and count for the attribute value. The Host Group Overview grid is also updated.
Operating Systems
Displays an interactive pie chart that visually depicts the Operating Systems for your attribute selection. For example, if you select Location and there are 21 hosts with that attribute, the pie chart shows the breakdown of the operating systems for the Locations by percentage and count. Click a sector to show the percentage for the attribute value. The Host Group Overview grid is also updated.
Host Types
Displays an interactive pie chart that visually depicts the Host Type for your attribute selection. For example, if you select Location and there are 21 hosts with that attribute, the pie chart shows the breakdown of the host type, such as VM Guests for the Locations by percentage and count. Click a sector to show the percentage for the attribute value. The Host Group Overview grid is also updated.
Host Group Overview
Displays a tabular report that visually depicts the attribute selection, and updates based on selections in the interactive pie charts. Management operations are also available from the grid. Select a host or backup server to activate the management functions on the action bar. For complete details about available operations, see
Managing Hosts and Backup Servers.