Field | Description |
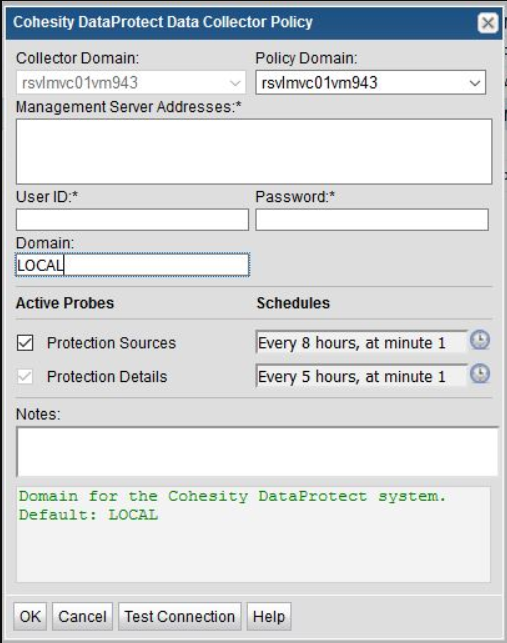
Collector Domain | The domain of the collector to which the collector backup policy is being added. This is a read-only field. By default, the domain for a new policy will be the same as the domain for the collector. This field is set when you add a collector. |
Policy Domain | The Policy Domain is the domain of the policy that is being configured for the Data Collector. The Policy Domain must be set to the same value as the Collector Domain. The domain identifies the top level of your host group hierarchy. All newly discovered hosts are added to the root host group associated with the Policy Domain. Typically, only one Policy Domain will be available in the drop-down list. If you are a Managed Services Provider, each of your customers will have a unique domain with its own host group hierarchy. To find your Domain name, click your login name and select My Profile from the menu. Your Domain name is displayed in your profile settings. |
Management Server Addresses | One or more DataProtect Management server IP addresses or host names to probe. Comma-separated addresses or IP ranges are supported, e.g. 192.168.0.1-250, 192.168.1.10, myhost Note: To collect from a Cluster, enter the IP address of only one of the management servers. To collect from multiple nodes, use the master node IP. |
User ID* | This field is required. View-only User ID and password for the Cohesity DataProtect storage system. |
Password* | This field is required. Password for the Cohesity DataProtect storage system. |
Domain | Domain for the Cohesity DataProtect system. The default value is LOCAL. |
Active Probes | |
Protection Sources | Probe for Cohesity DataProtect Protection Sources. |
Protection Details | Probe captures data about Protection Jobs, including their policies, schedules, sessions, and backups. |
Schedule | Click the clock icon to create a schedule. By default, it is collected at 4:04 am daily. Every Minute, Hourly, Daily, Weekly, and Monthly schedules may be created. Advanced use of native CRON strings is also available. Examples of CRON expressions: */30 * * * * means every 30 minutes */20 9-18 * * * means every 20 minutes between the hours of 9am and 6pm */10 * * * 1-5 means every 10 minutes Mon - Fri. Note: Explicit schedules set for a Collector policy are relative to the time on the Collector server. Schedules with frequencies are relative to the time that the Data Collector was restarted. |
Notes | Enter or edit notes for your data collector policy. The maximum number of characters is 1024. Policy notes are retained along with the policy information for the specific vendor and displayed on the Collector Administration page as a column making them searchable as well. |
Test Connection | Test Connection initiates a Data Collector process that attempts to connect to the subsystem using the IP addresses and credentials supplied in the policy. This validation process returns either a success message or a list of specific connection errors. Test Connection requires that Agent Services are running. Several factors affect the response time of the validation request, causing some requests to take longer than others. For example, there could be a delay when connecting to the subsystem. Likewise, there could be a delay when getting the response, due to other processing threads running on the Data Collector. You can also test the collection of data using the Run functionality available in Admin>Data Collection>Collector Administration. This On-Demand data collection run initiates a high-level check of the installation at the individual policy level, including a check for the domain, host group, URL, Data Collector policy and database connectivity. You can also select individual probes and servers to test the collection run. See
Working with On-Demand Data Collection for details. |