Configure a Pie Chart Dynamic Template
Pie charts require both a caption field and a numeric sector field. To create pie sectors for a non-numeric field, such as OS name, you simply can configure a Count function to render the count of the instances of the value. See also,
Examples of Pie Chart Dynamic Templates.
Tip: As a best practice, choose a pie chart that is provided as an out-of-the-box report template, then copy and customize it to see how it is configured.
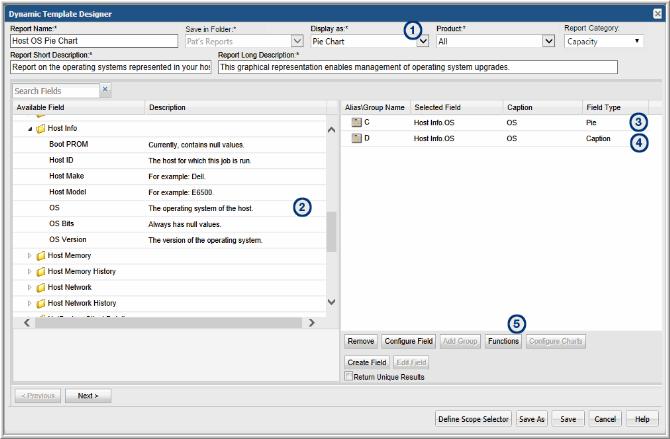
2. Drag or double-click fields to add them to the pane at the right of the window. Typically, you will need only a caption field and a sector field.
3. Sector Field: Double-click the field to configure it as a pie sector.
4. Caption Field: Double-click the field to configure it as a caption.
5. Select the Pie field and click Functions.
6. In the Function Builder window, click Add and select a COUNT function to count the instances of the value to return a decimal that can be graphed as a pie sector.
7. Be sure to complete the other mandatory fields for the template: Report Name, Short Description, and Long Description.
8. Click Define Scope Selector to configure the Maximum legends for Pie Chart. Overwrite the default value with the maximum that you want to see.
9. Save the Report Template.
The following example shows the steps to create a pie chart for the operating systems represented by the hosts in your environment. The steps noted in the following illustration reflect the main steps described in
Configure a Pie Chart Dynamic Template. Note that the HostInfo.OS field is used twice in this template, one for the Pie Sector and one for the Caption. Also, for the Sector field type, a COUNT function must be applied.
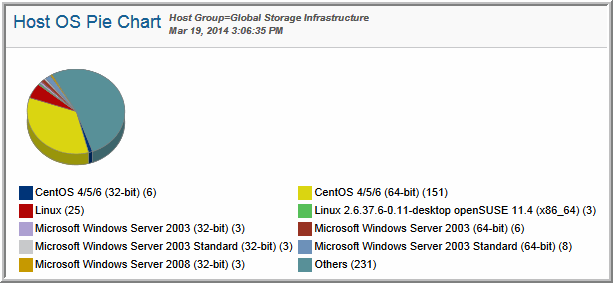
The Report Template defined in this example results in the following pie chart.
Examples of Pie Chart Dynamic Templates
The best way to learn how to define a pie chart report template is to learn by example.
The following list includes a sampling of the out-of-the-box reports that are shipped with the product, along with a few examples of the relevant information to help you isolate an example of the functionality that you are trying to implement.
To help you identify a field in the template that contains this functionality, the following convention is used in the list of report templates.
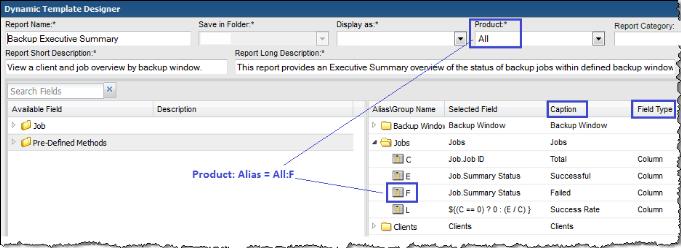
• Product:Alias combines the values listed in the template. In the following example, the selected Product is All, while the selected Alias is F.
• Some templates are vendor product-specific, in which case you may have a Product:Alias such as EMC Avamar:A
Report Template | Report Type | Product: Alias | Caption | Field Type |
Backup Manager Report |
Largest Backup Volume | Pie | All: C | Job size | Sector |


