How Reports and Caching Work Together
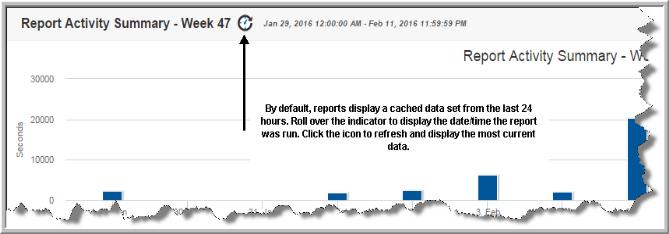
By default, reports display a cached data set from the last 24 hours.
When you run a report, IT Analytics takes the scope of the report, and checks if the cache contains the same report, for the same scope. If it does, the results are displayed from the cache. If the combination does not exist, the report is run from the database, saved in the cache, and then sent to the user interface. Cached reports are shared across users who belong to the same home host group.
When a report is served from the cache, an indicator icon is displayed on reports and dashboards. You can roll over the indicator to show the age of the report from the cache. Click the icon to purge the old report from the cache and rerun the report from the database. You can manually refresh at any time. See
Getting Started with the Inventory Navigator.

When a report is run, and it’s pulled from the cache, it does not show in the
Report Activity Summary or the
Report Activity Detail reports. These reports only show reports that ran and actually executed against the database.
Note: Scheduled, emailed and exported reports are not derived from the cache. These events are run in real-time, so current data is always used. Caching is only applicable for reports run in the browser.
Storing and Purging Data
The cache can retain up to 0.5 GB of reporting data and if it reaches capacity, it frees up space for new reports by purging the data for the least frequently used reports. You can change the retention value by revising the portal.properties parameter: portal.reports.cache.maxSizeInMemory. See
Configuring the Maximum Cache Size in Memory.
Purging also occurs when:
• Portal Tomcat service is stopped
• A cached report is more than 24 hours old
You can change the time period by revising the port.properties parameter: portal.reports.cache.timeOut. See
Configuring the Cache Time for Reports.
The cache can be stored in memory. By default, it is located in:
Linux:
/opt/tomcat/aptare_instances/portal/temp
Windows:
C:\opt\tomcat\temp
Optimistic caching is used to pre-generate reports related to Inventory objects a user may not have selected. For example, if you select a category in the Inventory with 12 VM Servers, and choose the first VM Server, the next nine servers displayed in the Hierarchy Panel are queued up to have their inventory reports run and populated in the cache. This enables a quick return of reports and almost instant results.
Note, optimistic caching is designed to limit the load to the CPU of the Portal server. This means, that in the case of a large number of objects with a large number of associated reports, the caching speed is throttled down.
The mechanism can be fine tuned using guidelines provided by APTARE Global Support Services.
Disabling Optimistic Caching with portal.properties
Administrators can disable optimistic caching using a portal.properties parameter: portal.ocn.optimisticReportCachingOn=false. See
Disabling Optimistic Caching for details.

