Configure a Line Chart Dynamic Template
Line charts provide an effective way to visualize metrics on a time line. These charts are particularly useful for performance metrics, where you want to compare multiple metrics to assess historical performance. There are times when a single chart containing multiple metrics will suffice. Likewise, there are times when a better comparison can be made with multiple charts containing a single metric per chart.
For details on two line chart approaches, see:
Tip: As a best practice, choose a line chart that is provided as an out-of-the-box report template, then copy and customize it to see how it is configured.
Line charts can be configured for the following:
• All subsystems - For example, all storage array vendors in your environment.
• Single subsystem - For example, a single storage array vendor, such as EMC Symmetrix. You cannot multi-select a subset of all of your subsystems for a report template.
Refer to the following instructions to build a line chart:
Line Charts for Performance Metrics
Line charts provide a meaningful visualization of performance over time. Use line charts to represent performance data, such as array performance metrics.
Array performance data is collected from certain storage arrays:
• NetApp ONTAP Cluster-Mode arrays
• Isilon arrays
• Array LUN performance statistics are collected for Dell Compellent, EMC VNX (CLARiiON), EMC Symmetrix, HDS Tuning Manager, HP 3PAR, IBM SVC, IBM XIV, NetApp ONTAP (Block only), NetApp Cluster-Mode and Pure Storage.
For collected array LUN performance raw data, the default retention period (504 hours or 21 days) controls the retention of the data. When the daily performance data ages out, it gets deleted.
Identify Array Performance Data Fields for a Template
Use the Search feature in the Dynamic Template Designer to find performance statistics in the database fields.
Historical performance metrics are collected for the following enterprise objects:
• Host - Chargeback, CPU, Memory, and Network history is available. Search on History in the Dynamic Template.
• Job - The backup/restore job itself has historical information associated with it. Each job record is the history.
• Storage Array - Search on Log in the Dynamic Template. Search on History in the Dynamic Template.
Rules and Guidelines for Performance Line Charts
Several rules govern the creation of a line chart for performance metrics, as listed in the following table.
Rule for Performance Metrics Line Charts | Description/Example |
1. If aggregation is defined for a line, all lines must have an aggregation specified. | |
2. The Group By scope selector component is required only if the lines have aggregation functions applied. | |
3. If no aggregation has been specified for lines, the raw data will be returned in the report. | Array performance data is captured and stored as raw, hourly, and daily records. When raw data is used, the dates reflect exactly when the data was captured, including the seconds. |
4. A date field should be defined as the caption. | This provides the x-axis time period markers. Note that time-series charts automatically calculate the x-axis labels based on the data. Therefore, your Group By selection in the scope selector may not always render with the set of dates that you expect for the time period. |
5. The Time Period scope selector is always required for performance line charts. | Performance metrics are best represented as time-series charts. |
6. Use the Add Group option to create folders when you need to group data fields that have disparate units of measure. | For example, you might have a capacity value in KiB, but a performance value in Kbps. This requires two charts with different metrics scales to plot the values. |
Steps to Create a Line Chart Dynamic Template
To create a line chart report template, start with the following steps.
1. Select Tools > Dynamic Template Designer.
2. Choose an Enterprise Object (Data Domain, Host, Job, or Storage Array) and click OK.
3. In the Dynamic Template Designer, select a folder to save the template into and
the display type. Be sure to select Line Chart, as it enables options specific to this feature.
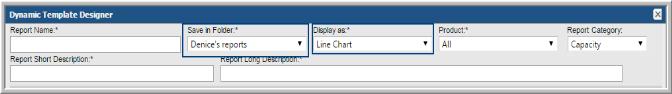
4. Enter a report name, short description, and long description.
5. Optionally, assign a category to set how report templates are categorized in the Inventory. When displayed in the Inventory, templates are sorted into information categories such as performance, storage or forecasting. If a category has not been selected, these templates are displayed under the heading Uncategorized. You can always assign a category, by customizing an existing template.
6. Drag fields into the report scope and reference the following sections to determine how fields should be configured.
7. At the bottom of the Dynamic Template Designer, click Configure Charts to define the label and metric unit to be displayed in the y-axis.
Line Chart Field Requirements
In its simplest form, a line chart requires a
Caption field and any number of
Line fields. For more complex scenarios, see
One Object Per Line Chart, One or More Metrics Per Chart and
Multiple Objects Per Line Chart, One Metric Per Chart.
Line Chart: Caption Field
This required field type supplies the category caption for the x-axis. Typically, a date field becomes the caption because line chart data is best represented over a time line. When you configure a date field as a caption, the field configuration automatically sets
Group By to
Yes, so that in the scope selector, a list of time frames is provided.
See also,
Format Line Chart Fields.
Line Chart: Line Field
At least one line field must be defined in a line chart template. A numeric field can be configured as a line. One or more line fields can be included in a line chart report template. Select
Line for the field type and then select a color Also, use an aggregation function, such as SUM to provide meaningful values in the chart.
Note that line colors do
not apply to the “multiple objects per chart” scenario. In this scenario, line colors will be determined dynamically by the system, since the number of objects represented by the lines is unknown until run time. See
Multiple Objects Per Line Chart, One Metric Per Chart.
Line Chart: Group by Object Field
When you configure a Group by Object field, essentially you are defining, “for each object, display metric lines.” Group by Object has the following requirements:
• Only one Group by Object field can be defined for a line chart.
• When a Group by Object field is configured, one field in the template must have Column Break set to Yes. This Column Break field should have unique values. For example, LUN names typically are duplicated in a storage environment, but the LUN ID uniquely identifies a LUN. In this example, a LUN ID should be included in a template as a Hidden field with a Column Break. Only one field in a template can have the Column Break set to Yes.
• If the line chart report template includes a field of type, Group by Object, the scope selector must have the Top/Bottom and the Group Chart By selections checked.
Line Chart: Hidden Field
A Hidden field comes in handy when you want to ensure that an object is unique, but you don’t want to display that field in the report. For a scenario where a Hidden field is useful, see
Line Chart: Group by Object Field.
Line Chart: Exclude Field
There will be cases when a field will be needed only for filtering purposes and you do not want this field to be included in the selected fields for the report template. For example, you may want to filter on backup jobs that are only failed and partial. In this case, you would drag in the job status field, make it an Exclude field type, and
Configure a Static Filter.
One Object Per Line Chart, One or More Metrics Per Chart
A single line chart can be used to visualize multiple metrics for a single enterprise object. For example, you might have a host with degraded performance and you want to view all the metrics for that host within a given time period. You want to examine swap file activity, free and used, over time. Each chart would have two metrics lines. At run time, the user might select 10 hosts and the resulting report would show 10 charts, one per host enterprise object.
At run time in the Scope Selector:
• Choose one or more objects to be included in the chart.
• Choose from the Group Chart By pick list: Chart Per Object.
Configure One Object Per Line Chart
Configure the following settings to create a report template for a chart that contains several metric lines per object chart. Each object in the report’s scope will have its own chart in the report.
Field Configuration for One Object Per Line Chart
• Caption Field - This required field type supplies the category caption for the x-axis. Typically, a date field becomes the caption because line chart data is best represented over a time line. When you configure a date field as a caption, the field configuration automatically sets Group By Date to Yes. See also, Format Line Chart Fields. • Line Field - A numeric field can be configured as a line. One or more line fields can be included in a line chart report template. Select Line for the field type and then select a color.
• Add Group - (Optional) Use this option to create folders when you need to group data fields that have disparate units of measure. For example, you might have a capacity value in KiB, but a performance value in Kbps. This requires two charts with different metrics scales to plot the values. In the Dynamic Template Designer, click
Add Group to create a folder for each group so that each group will have its own chart. Once you create a group, every field within the template must reside within a group, so you will likely need to create additional groups that will include the remaining fields. Note that the Group functionality is used in tabular reports to create spanning headers, but in the case of line charts, it enables separate charts. See
Add a Group to Create Separate Line Charts in a Report.
• Column Break - (Optional) Enable this setting on either an object name or object ID; for example, array name or array ID. This setting creates a chart for each object, such as each array in the report scope. For Line Chart report templates, if the template includes a field of type, Group By Object, one field must have Column Break set to Yes. Typically, a field of type, Group By Object or Hidden, is used for a Column Break. This field must have unique values, such as an Array ID. Only one field can have the Column Break set to Yes. See also
Column Break for Line Chart Report Templates.
• Group by Date - If a date field is configured as a caption, the Group by Date setting is automatically set. However, if more than one date field is included in the template, you must select which date field should have the Group by Date setting set to Yes.
Scope Selector Configuration for One Object Per Line Chart
• Group By - If the scope selector has the Time Period component checked, the Group By component must also be checked. This enables the user to select the time units at run time: Hours, Days, Weeks, Months, Quarters, or Years.
• Group Chart By - This component lets the user select: Chart Per Object or Chart Per Metric. If the line chart report template includes a field of type, Group By Object, the scope selector must have the Group Chart By selection checked.
• Time Period - Use this component to specify the time span for the generated report.
• Top/Bottom - This enables selection of the Top n or Bottom n values, based on a metric/field. If the line chart report template includes a field of type, Group By Object, the scope selector must have the Top Bottom selection checked. When Top/Bottom is selected, an additional “Based on” selector will appear in the scope selector to choose an associated metric.
Multiple Objects Per Line Chart, One Metric Per Chart
A single line chart can be used to compare a single metric for a group of enterprise objects. As shown in the example,
One Object Per Line Chart, One or More Metrics Per Chart, the same template definition can be used. At run time, the user selects Chart Per Metric and chooses 10 hosts. The resulting report would show two charts, one for swap file free and second for swap file used, with each chart displaying 10 lines for the 10 hosts in the scope.
At run time in the Scope Selector:
• Choose one or more objects to be included in the chart.
• Choose from the Group Chart By pick list: Chart Per Metric.
Field Configuration for Multiple Objects Per Line Chart, One Metric Per Chart
• Caption Field - This required field type supplies the category caption for the x-axis. Typically, a date field becomes the caption because line chart data is best represented over a time line. When you configure a date field as a caption, the field configuration automatically sets Group By to Yes. See also, Format Line Chart Fields. • Line Field - A numeric field can be configured as a line. One or more line fields can be included in a line chart report template. Select Line for the field type. In this multiple objects per chart scenario, a line represents a specific object.
Note that line colors do not apply to this “multiple objects per chart” scenario. Line colors will be determined dynamically by the system, since the number of objects represented by the lines is unknown until run time.
• Column Break - Use this setting to define how many points are represented by the line. For Line Chart report templates, if the template includes a field of type, Group By Object, one field must have Column Break set to Yes. This field should have unique values. For example, LUN names typically are duplicated in a storage environment, but the LUN ID uniquely identifies a LUN. In this example, a LUN ID should be included in a template as a Hidden field with a Column Break. Only one field in a template can have the Column Break set to Yes.
• Group by Date - If a date field is configured as a caption, the Group by Date setting is automatically set. However, if more than one date field is included in the template, you must select which date field should have the Group by Date setting set to Yes.
Format Line Chart Fields
When formatting a line field, note that the Unit Converter only formats the mouse-over text,
not the label for the Y-axis. See
Valid Formatter Patterns.
Line Chart Scope Selections
• If a
Time Period is selected for the scope selector,
Group By must also be checked if the lines contain an aggregation function. See
Aggregation Functions.
• If the line chart report template includes a field of type, Group by Object, the scope selector must have the Top/Bottom selection checked.
• If the line chart report template includes a field of type, Group by Object, the scope selector must have the Group Chart By selection checked.
Examples of Line Chart Dynamic Templates
The best way to learn how to define a line chart report template is to learn by example.
The following list includes a sampling of the out-of-the-box reports that are shipped with the product, along with a few examples of the relevant information to help you isolate an example of the functionality that you are trying to implement.
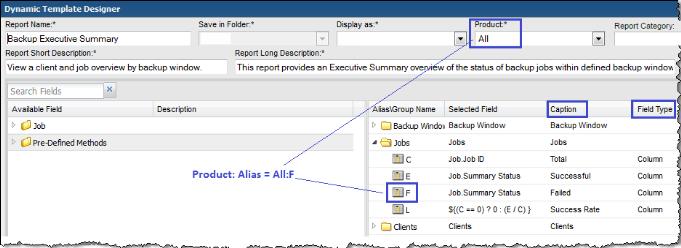
To help you identify a field in the template that contains this functionality, the following convention is used in the list of report templates.
• Product:Alias combines the values listed in the template. In the following example, the selected Product is All, while the selected Alias is F.
• Some templates are vendor product-specific, in which case you may have a Product:Alias such as EMC Avamar:A
Report Template | Product: Alias | Caption | Field Type | Functions | Group |
Capacity Manager Reports |
EMC Isilon File System Performance by Protocol | EMC Isilon: H | Max Bytes Out | Line | MAX | Yes |
| EMC Isilon: A | # Active Clients | Line | AVG | Yes |
NetApp Cluster-Mode NFS Performance by Vserver | NetApp Cluster-Mode: B | Cluster Name | Group By Field | | Yes |
| NetApp Cluster-Mode: D | Avg Write Latency | Line | AVG | Yes |
NetApp Cluster-Mode Performance by Node | NetApp Cluster-Mode: H | Log Date | Caption | | Yes |
| NetApp Cluster-Mode: N | Disk Read | Line | AVG | Yes |