Working with Dashboards
You can drag and drop individual reports, to create a consolidated view to contain reports you access regularly, or view multiple scenarios simultaneously. Dashboards can also help you troubleshoot a particular problem by gathering data from multiple reports into one view.
Understanding Dashboard Icons
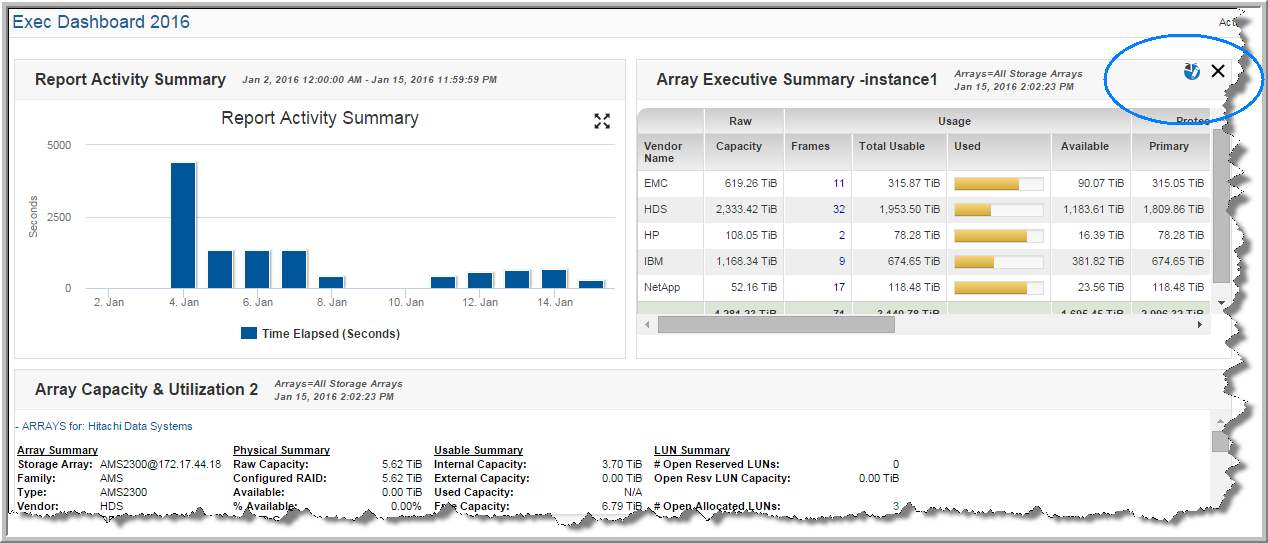
Once placed on a dashboard, you can revise the scope or remove the report entirely. These functions are displayed when you hover your cursor over the report title. The placement varies depending on the report type, but icons are displayed in the top right corner of your report portlet. You can change a report location by simply dragging it to a new position. See also
Interacting with Reports.
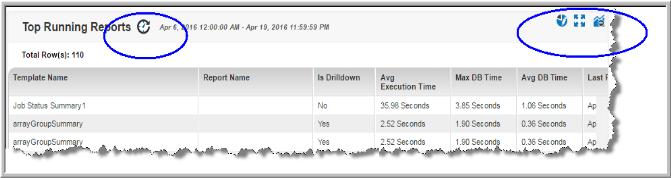
| Data Age Indicator - When a report is served from the cache, an indicator icon is displayed on reports and dashboards. You can roll over the indicator to show the age of the report from the cache. Click the icon to rerun the report from the database. See About Cached Reports on Dashboards for more information. |
| Edit Scope - Allows you edit the scope of the individual report portlet and rerun the report without impacting the entire dashboard. See Editing the Scope for a Report on a Dashboard for details. |
| Remove Report from Dashboard - As you use your dashboards, you may find that some reports are no longer relevant. These reports can be quickly removed from your dashboard. See Removing Reports from Dashboards. |
| Expand - Charts displayed as components of a dashboard may be hard to read. Click the Expand icon to pop the chart out of the dashboard and have it displayed in the full browser window. See Expanding a Report to Full Size on a Dashboard. |
About Cached Reports on Dashboards
When you run a report, StorageConsole takes the scope of the report, and checks if the cache contains the same report, for the same scope. If it does, the results are displayed from the cache. If the combination does not exist, the report is run from the database, saved in the cache, and then sent to the user interface.
When a report is served from the cache, an indicator icon is displayed on reports and dashboards. You can roll over the indicator to show the age of the report from the cache. Click the icon to rerun the report from the database. See also
How Reports and Caching Work Together.
Creating New Dashboards and Adding Reports
Dashboards provide a custom, at-a-glance overview by displaying reports you choose on a single page. You can also add a reference to an external resource. You can create an tabular report template with a frame that can be populated from another URL providing HTML5 content. See
Adding an External Reference.
To create a dashboard and add reports
1. Search and generate each report you want on your dashboard. Each report will display in a separate tab.
2. Click the
Add Dashboard tab, once all the reports are generated.
3. Click and drag the tab of each report you want to place on the dashboard. You can add an unlimited number of reports to a custom dashboard, but you are limited to four horizontal columns. You can resize row heights at any time using Set Layout.
Note: A report that has been generated as a result of a drill down in another report cannot be saved or added to a dashboard because of the dependency with the parent report.
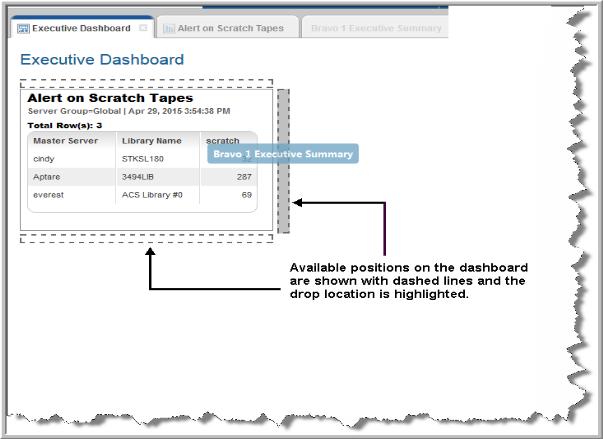
4. As you drag the report on to the dashboard, areas are highlighted indicating the potential positions of the report. You can change the report’s by location by dragging it to a new position.
5. Click Actions and select Save.
6. Assign a name to the dashboard. The maximum number of characters is 80.
Note: Reports on dashboards are treated as stand-alone instances and are not linked to the original report. For example, when a name or scope change is made in the original report, those changes are not reflected in the dashboard version.
Adding Reports to an Existing Dashboard
You can quickly add new reports to your dashboard as your business needs change.
To add reports to an existing dashboard
1. Search for the dashboard name using Search.
2. Run the dashboard directly from the search results. The updated dashboard is displayed.
3. Search and generate each report you want to add to your dashboard. Each report will display in a separate tab.
4. Click and drag the tab of each report you want to place on the dashboard. You can add an unlimited number of reports to a dashboard, but you are limited to four horizontal columns. You can resize row heights at any time using Set Layout.
Note: A report that has been generated as a result of a drill down in another report cannot be saved or added to a dashboard because of the dependency with the parent report.
5. As you drag the report on to the dashboard, areas are highlighted indicating the potential positions of the report. You can change their location by dragging them by the title to a new position.
6. Click Actions and select Save.
Saving a Dashboard with a Different Name
Once you’ve created a dashboard you like, you can make modifications and save the dashboard with a different name.
To save a dashboard with a different name
1. Select and run a saved dashboard.
2. Click the
Actions menu
and select
Save As.
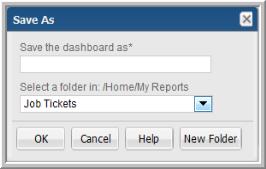
3. Enter a descriptive dashboard name.
4. Choose a folder or create a new one within your My Reports folder.
Editing the Scope for a Report on a Dashboard
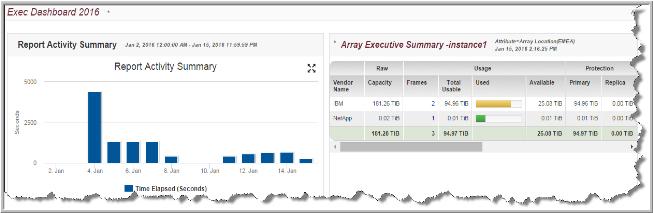
You can edit the scope for an individual report on a dashboard. This allows you to create what-if analyses or troubleshoot an issue by changing the data set and creating a preview report. Once you’ve changed the scope, regenerate the report. The report title is displayed in red italic to indicate a change has occurred. You can save your changes or just close the dashboard to retain the original scope.
To edit the scope for a report on a dashboard
1. Search for the dashboard name using Search.
2. Run the dashboard directly from the search results. The updated dashboard is displayed.
3. Roll your cursor over the corner of a report on the dashboard to display the
Edit Scope icon.
4. Click the
Edit Scope icon to display the Scope Selector for the report.
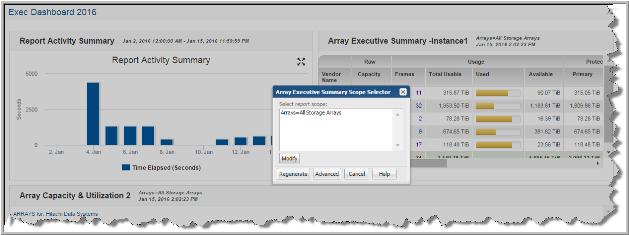
5. Regenerate the report. The report title and the dashboard name are shown in red italics to indicate a change has been made to the dashboard.
6. Save the changes to update the dashboard with the new scope. You can also close the dashboard to discard the scope changes and retain the original scope.
Expanding a Report to Full Size on a Dashboard
The Expand icon pops the chart out of the dashboard and displays in the full browser window.
To expand a report on a dashboard
1. Search for the dashboard name using Search.
2. Run the dashboard directly from the search results. The updated dashboard is displayed.
3. Hover your cursor over the report title. The icons are displayed.
4. Click the Expand icon. The report portlet is displayed in full screen mode. Drill downs are still accessible.
5. Click the Close icon to return to the dashboard.
Setting the Layout on a Dashboard
The Set Layout function allows you to resize row heights on the dashboard and to toggle the report headers on and off for an optimal visualization of your data.
To change the portlet row height on a dashboard
1. Select
Set Layout from the
Actions menu with your dashboard active.
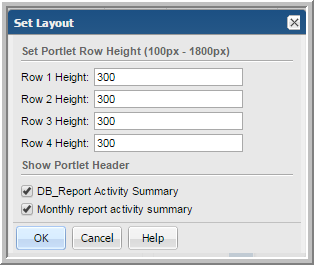
2. Set the row height for reports grouped horizontally on the dashboard. Each row is controlled individually.
3. Enter a value per row. The range is 100 to 1800 pixels. The default is 300 pixels.
To show/hide portlet headers on a dashboard
1. Select Set Layout from the Actions menu with your dashboard active.
2. Deselect the reports to remove the header. By default, the header on the report is displayed.
Deleting a Dashboard
Use the information displayed in the Reports tab to help assess the impact of deleting a dashboard. For example, you can determine if you’ve shared your dashboard with other users.
To delete a dashboard
1. Locate and select the dashboard on the Reports tab.
2. Click Delete on the Action bar.
Removing Reports from Dashboards
As you use your dashboards, you may find that some reports are no longer relevant. These reports can be quickly removed from your dashboard.
To remove a report from a dashboard
1. Search for the dashboard name using Search.
2. Run the dashboard directly from the search results. The updated dashboard is displayed.
3. Hover your cursor over the report title. The icons are displayed.
4. Click the Remove Report from Dashboard icon. You can reposition the remaining reports by dragging them by the title to new locations.


