Drive Performance Summary Report
Explore your data center using APTARE customizable report templates or by using parts of your IT infrastructure as entry points. Use Search to find reports, templates and dashboards across the portal.
Use the Reports tab to examine the catalog of templates, dashboards and reports - organized by products along with user-created, and system folders. This report is located here:
Backup Manager > Storage Utilization Reports > Drive Performance Summary
This report also can be generated via a link in the
Drive Utilization & Performance Report.
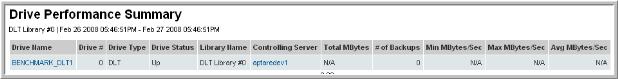
This report provides high-level drive details for the reporting period that you specified in the report scope.
Note: If you are accessing this report from the navigation pane, be sure to define a host group scope that is unique by product type—for example, only NetBackup servers. Also, this report is not supported for Veritas Backup Exec or IBM TSM data because data collection does not capture the association between backup jobs and tapes.
Drive Name | |
Drive # | Drive index. |
Drive Type | The drive type label. |
Drive Status | The current status of the drive. |
Library Name | The name of the library. |
Controlling Server | Links to the controlling server’s details in a Host Details Report. |
Total MBytes | Total MBytes used. A total for all drives is shown at the bottom of this column. |
Number of Jobs | The number of backups that used this drive. |
Min MBytes/Sec | These three values provide indicators of the drive’s performance. The Maximum rate represents the fastest speed that a job ran during the selected time frame. Likewise, the Minimum rate represents the slowest speed that a job ran during the same time frame. For NetBackup specifics, see NetBackup Drive Performance Summary. |
Max MBytes/Sec |
Avg MBytes/Sec |
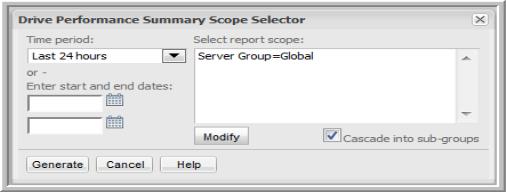
As an alternative to Host Group scope, you can select Tape Libraries as the scope:
1. In the Drive Performance Summary Scope Selector window, click Modify to change the scope.
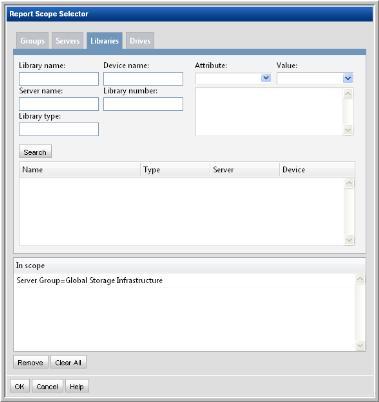
2. In the Client Selection window, first click Clear All to remove the host groups from the “In scope” pane.
3. Click the Tape Library tab to display the list of possible tape libraries in your environment.
4. Double-click the tape libraries to include them in the scope and then click
OK.
NetBackup Drive Performance Summary
For NetBackup jobs, the drive performance algorithm takes into account the use of multiple tapes, as some backups require the dismounting and re-mounting of several tapes. The Kilobytes/second rate is calculated for each piece of tape media used by the backup job.
mediaKilobytes / ((finishReadWrite - startReadWrite) * SECS_IN_A_DAY * (mediaKilobytes/jobKilobytes))
Where:
• mediaKilobytes is the total kilobytes written to an individual piece of tape media
• jobKilobytes is the total size of the backup job, as reported by bpdbjobs
• startReadWrite is the date/time that the job started writing to the tape
• finishReadWrite is the date/time that the job finished writing to the tape
The Drive Performance Summary report displays the minimum, average, and maximum overall drive performance for all jobs for the reporting period. When you drill down to an individual tape drive, the Drive Performance Detail Report uses this same algorithm to display the performance of each job. If there are multiple rows for a single job, such as when multiple tapes are used by the job, the performance metric is averaged across all the rows returned from the above algorithm.
The details from which drive performance is derived can be viewed via drill down links. In the
Drive Performance Detail report, click on the
Finish Date for one of the backup jobs to view the Job Details. At the bottom of the
Job Details Report, the backup attempts (try records) are displayed.