Host Inventory Management
Now that you’ve set up the prerequisites, you’ll use the steps described in this section for on-going Host Inventory Management. For additional prerequisite details, see
Host Access Requirements and
Host Inventory Configuration Steps.
Once the prerequisite settings have been configured, a Host Discovery Policy must be created to enable the process of finding hosts in your environment and populating your inventory of hosts.
The Host Inventory Management processes include:
• Configure and validate hosts in the inventory
• Enable and manage on-going collection
Several tools facilitate Host Inventory Management, as described in the following sections:
Configure Host Discovery Policies to Populate the Host Inventory
Host Discovery begins with a Discovery Policy, which identifies the Data Collector that will gather information about hosts in your environment. In addition, a policy has an associated set of credentials, WMI proxies, and paths to access commands on the hosts. For additional prerequisite details, see
Host Resources Prerequisites and Configurations,
Host Access Requirements, and
Host Inventory Configuration Steps.
A Discovery Policy typically is used once to initially populate your host inventory. Executing a discovery policy more than once has no effect for hosts that were previously discovered. To identify and resolve connectivity issues, see
Validate Host Connectivity.
Although all hosts can be included in a single policy, you might want to create one or more Host Discovery Policies in the following recommended groupings:
• by OS (Windows or Linux) - This grouping is essential, as the probes and parameters are OS-specific.
• by common attributes, such as User ID, password, access control commands (sudo, pbrun, sesudo), PATH
• by application, such as Oracle or Exchange
Discovery Policy Considerations
If your enterprise configures hosts to lock out access after multiple failed authentication attempts, take the following tips into consideration:
• If you choose more than one credential in the Discovery Policy credentials list, you risk host authentication failure lock-out. The discovery process will try the first credentials and if they fail, discovery will try the next credentials that you’ve selected. Therefore, if your hosts are configured to prevent multiple authentication retries, multiple failed attempts may cause a lock-out.
• If multiple Discovery Policies are running simultaneously, with one policy using an IP address to access the host and the other policy using a name to access the host, the multiple access attempts may cause a lock-out. Note that if the authentication attempts are successful, only one host record is added to the inventory.
Configure a Discovery Policy
Note: A Discovery Policy typically is used once to initially populate your host inventory. Executing a discovery policy more than once has no effect for the subsequent runs for hosts that have already been discovered and added to the inventory.
For additional information about Host Inventory Discovery and Management, see:
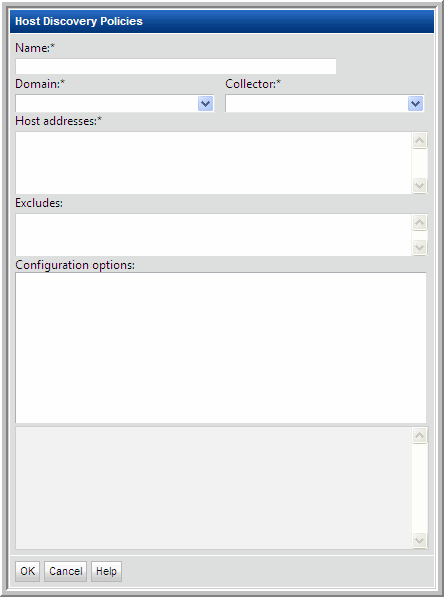
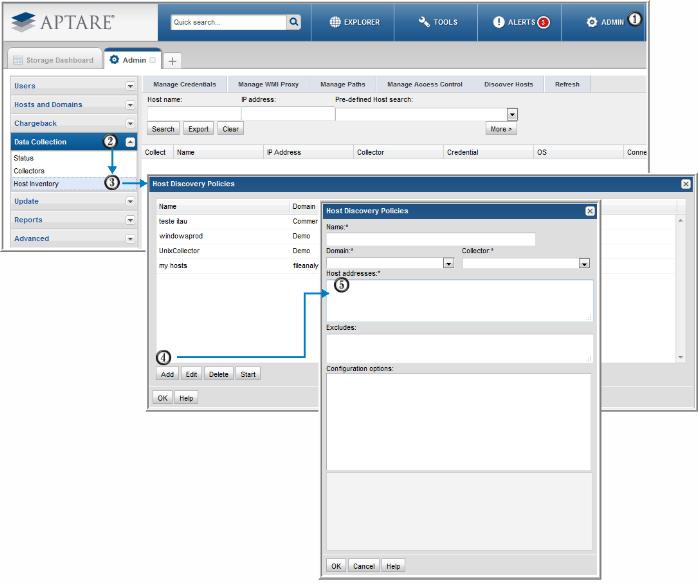
To create/edit Host Discovery Policies, select Admin > Data Collection > Host Inventory
1. In the Host Inventory toolbar at the top of the browser window, click Discover Hosts.
2. Add, Edit, or Delete settings using the buttons at the bottom of the window.
3. Click Add to configure settings and then click OK.
Field | Description | Sample Values |
Name* | Assign a name to identify this Discovery Policy. | |
Collector* | Select the data collector from the drop-down list | |
Domain* | Select the StorageConsole Domain from the list; for most environments, only one Domain is displayed. Multiple domains facilitate management for Managed Services Providers (MSPs). | |
Host addresses* | • A range of IP addresses can be specified • Hostnames and/or IP addresses can be listed, separated by commas | 192.168.0.1-250 172.168.1.21, ABChost1, ABChost2, 172.168.1.58 |
Excludes | List any known IP addresses that you know are not valid for host collection; for example, the IP address of a printer. IP address ranges are also supported. | |
Configuration options | This list gets populated when you select a Domain at the top of the Host Discovery Policies window. • Credentials • WMI Proxies • Paths Expand these lists to select the configurations to be used by this Discovery Policy. IMPORTANT NOTE: If you choose more than one credential in the list, you risk host authentication failure lock-out. The discovery process will try the first credentials and if they fail, discovery will try the next credentials that you’ve selected. Therefore, if your hosts are configured to prevent multiple authentication retries, multiple failed attempts may cause a lock-out. | |
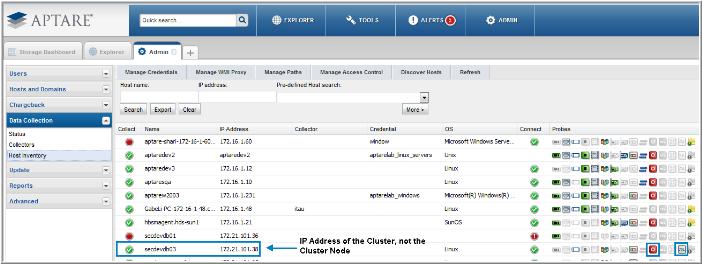
Collecting from Clustered SQL Server and Oracle Applications
Collection from clustered SQL Server and Oracle applications requires a specific data collection configuration. Typically, when configuring a Host Discovery Policy, the IP address of the specific host/node should be configured in the policy for direct access to the host’s data. See
Configure a Discovery Policy.
In a clustered environment, however, the following configurations are required to gather the host data.
• The Application Probe requires the IP address or host name of the Cluster (
not the IP address or host name of the Cluster Node). See
Figure 13.2 for an
Application Probe Example.
Note: If Cluster Nodes already have been discovered, they should be removed from the Host Inventory.
Figure 13.1 Host Discovery Policy Configuration Steps
Figure 13.2 Application Probe Example
Execute and Monitor Host Discovery
Execute a Discovery Policy
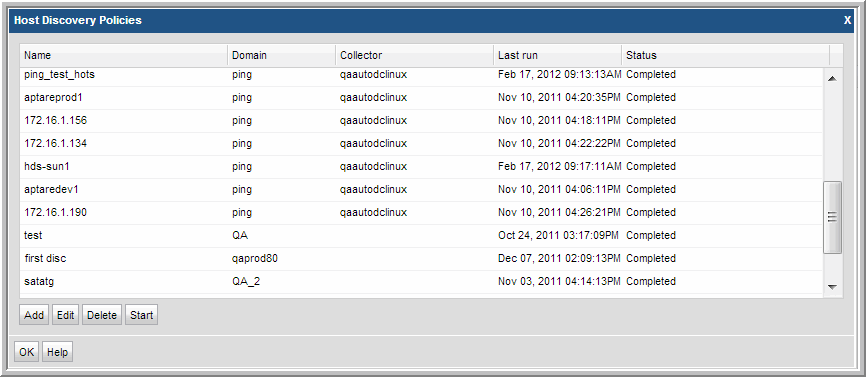
1. In the Host Inventory toolbar, click Discover Hosts to list the Host Discovery Policies.
2. In the Host Discovery Policies window, select the Discovery Policy.
3. Click Start.
At this point, the discovery process will begin. It may take a few minutes for the background processes to initiate the discovery.
4. Click OK.
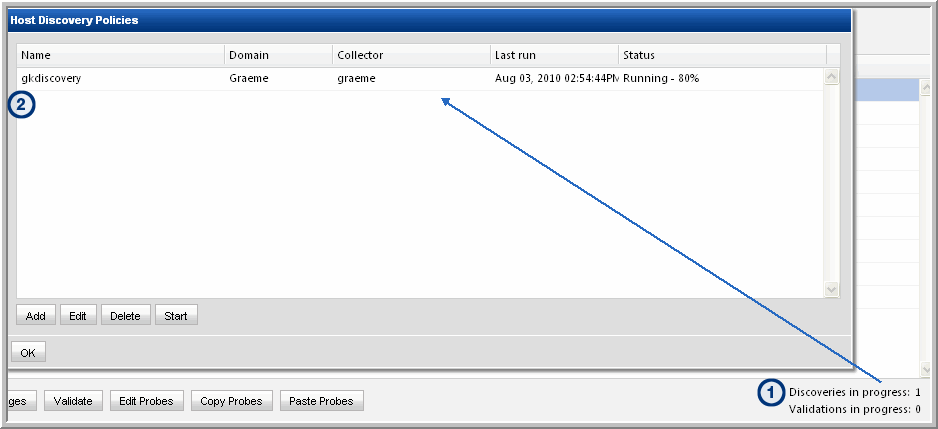
Monitor Discovery Processes
Several methods can be used to monitor progress:
Method 1
1. At the bottom of the Host Inventory window, double-click the Discoveries in progress link to launch the Host Discovery Policies window.
Note the Status at the right of the window.
2. Double-click the Discovery Policy to view the settings.
Method 2
1. Using the Host Inventory
Advanced Search Parameters function, search for hosts associated with a Discovery policy to see what hosts have been found.
Validate Host Connectivity
The Validate step executes the necessary validation steps and provides a summary of the overall success/failure. The Validation process steps through a handshake process, executing the preliminary steps that will occur during data collection. The informative messages enable you to pro-actively identify issues prior to initiating the data collection process.
Validate Hosts
The Validation process identifies issues such as:
• Credential Validation Failures - Verify account IDs and passwords.
• Probe Errors - For example, an HBA probe may fail on a host that does not have an HBA. Other similar errors include iSCSI port not found or LUN not found.
• Connection Failures - The host may not be reachable.
• DNS Lookup Failures - IP addresses may not have been configured correctly.
• OS Verification Failures - Check the Access Control or WMI Proxy settings. In addition, verify that the paths are valid for the host’s operating system.
• Server Command Errors - Verify that the Path and Access Control settings are correct.
Validation automatically occurs when the Data Collection processes are initiated; however, you can manually start the processes to get immediate feedback so that you can troubleshoot issues.
1. In the Host Inventory window, search for hosts. You can search by a Discovery Policy to see the results of a discovery. See
Monitor Discovery Processes.
2. Click on one or more hosts and then click Validate at the bottom of the window.
3. To verify that the validation has begun, click Show Validations at the bottom right of the window.
A list of the hosts that are currently being validated will be displayed. See
Validation History.
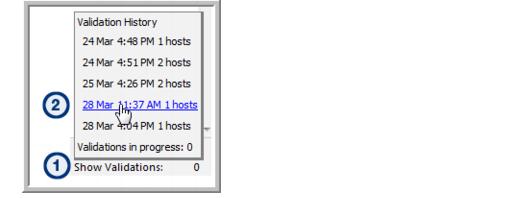
Validation History
Once a set of hosts have been selected for validation the current status, as well as the history, can be viewed in a pop-up box.
1. At the bottom right of the Host Inventory window, click Show Validations.
• Validation History: A list of the past 10 validations is displayed. These are hyperlinks that can be used to access the list of hosts associated with that validation process.
• Validations in progress: Click this link to view the status of the current validation process.
2. Click the link to either display validations in progress or the hosts that were included in previous validations.
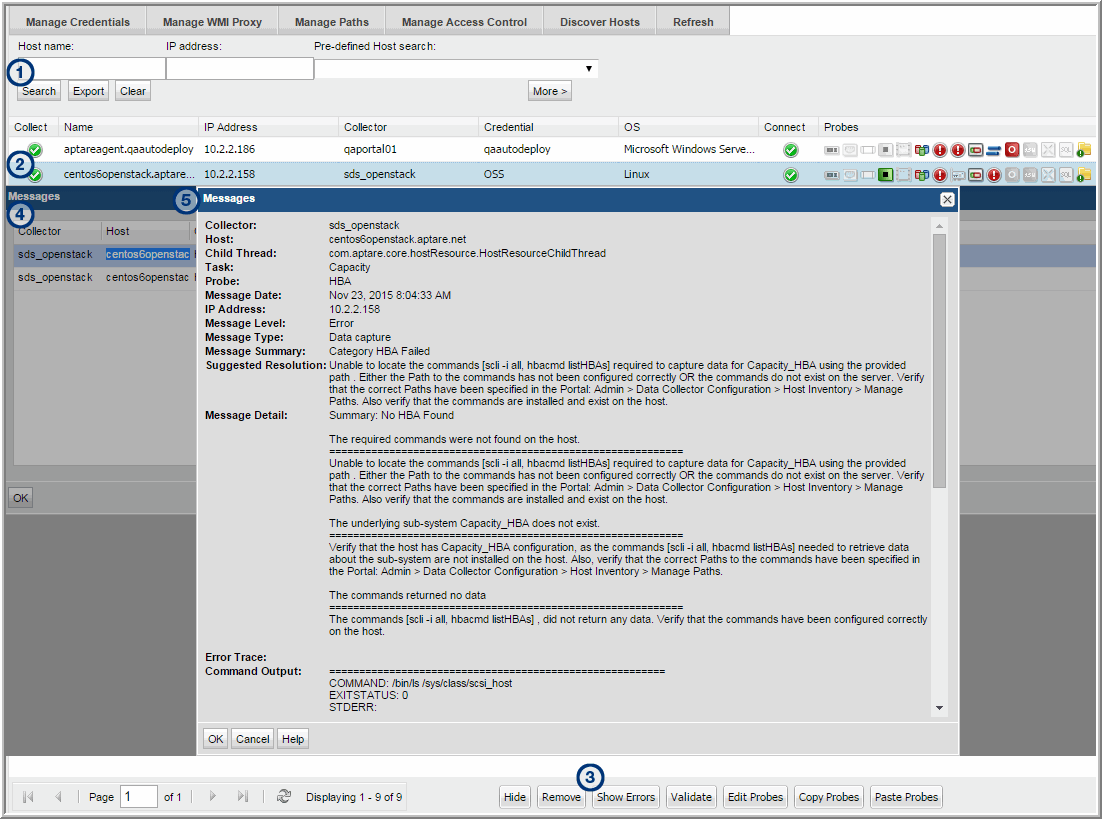
Show Errors
Before host data can be successfully collected, a number of configuration steps need to be taken. The Show Errors button enables you to identify details to help you troubleshoot host inventory collection issues.
Show Errors lists issues specific to:
• Connectivity
• Probes
• Validation
Use the following example and steps to view troubleshooting messages.
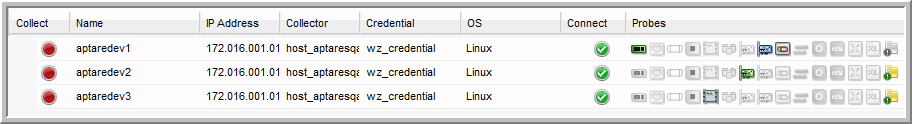
1. Search the Host Inventory to view a list of hosts.
2. Select a host in the list that displays failure icons (in the above example, three probes have exclamation points in red circles).
3. Click Show Errors to display the Messages window for the selected host.
4. Double-click a message in the Messages window to view the details.
5. Take the recommended steps provided in the message details to rectify the issue. Then, re-validate the host.
Filter the Host Inventory - Hide/Unhide, Remove
The Host Discovery process populates your inventory with hosts it finds. Often, discovery policies are designed to discover an IP address range. Host Discovery creates a record for every IP address in the range, even if it’s not in use. Therefore, invalid IP addresses will appear in your Host Inventory. In addition, Discovery may find printers, routers, or switches, or other devices that aren’t relevant for host data collection.
To filter your host inventory to include only hosts for which you want data collected, use the following options:
• Hide - Select a host in the inventory and click Hide at the bottom of the window. When you Hide a host, it will not appear in your search results.
• Unhide - If you list hosts that have been hidden, the
Hide button will be toggled to Unhide. Use the
Advanced Search Parameters option,
Search hidden hosts, to view a list of hidden hosts.
• Remove - Select a host in the inventory and click Remove at the bottom of the window. When you choose to remove a host, if you execute the Discovery Policy again, it will re-add it to the inventory. You may have an IP address that is now associated with a device that is different from the one that was discovered.
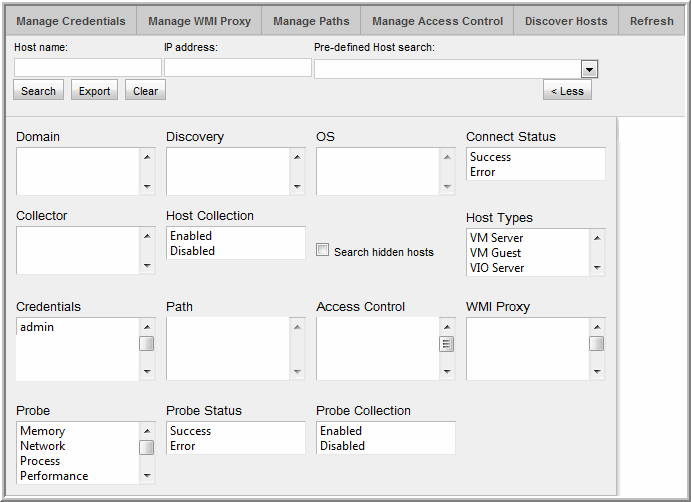
Host Inventory Search and Host Inventory Export
The Host Inventory window offers a Search feature to help you find hosts that have been discovered.
Basic Search
Note: A search with no specified criteria returns all hosts in your inventory.
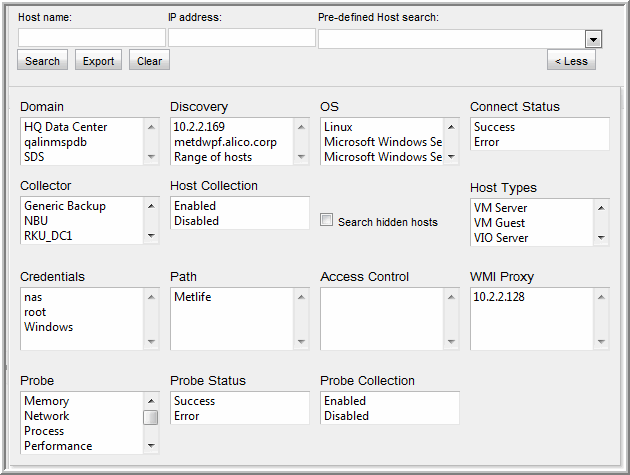
Pre-Defined Search
Several pre-defined searches enable easy access to host lists that are useful for troubleshooting.
• Active policy but not collected since... (Note: When you select this option, a calendar pop-up enables date selection.)
• No active policy but was previously active (This means host data was successfully collected at an earlier time.)
• Credentials failing but were previously successful
• Collections failing but were previously successful
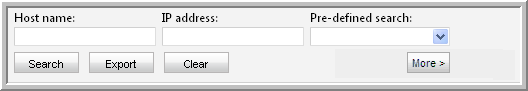
• For more specific search parameters, click
More (once clicking More, the button displays
Less) to enter
Advanced Search Parameters.
Advanced Search Parameters
• Select specific search criteria to narrow the list of hosts displayed in the inventory.
• When you check the Search hidden hosts box, only hidden hosts will be displayed in the Host Inventory window. Also, the Hide button in the Host Inventory window will toggle to Unhide.
• When searching on Probes, if a probe was at some point activated, but then de-activated, it will appear in the search results because there is an entry in the database table.
Export the Host Inventory
To export the details of the Host Inventory to a comma-separated-values file (.csv):
2. In the Search area at the top of the Host Inventory list, click Export.
The resulting file will include values for the status of each of the available probes. For example, the values will be similar to N/U or Y/S, as described in the following table.
E | Error |
F | Failure |
N | No - Not Active |
S | Success |
U | Unknown |
W | Warning |
Y | Yes - Active Probe |
Configure and Edit Host Probes
Host Resources Data Collection can gather the following information by probing hosts:
• Host Probes: Capacity (HBA, iSCSI, Volume Manager, Multi-pathing)
• Host Probes: Memory, Network, Process, Processor, System
• Application Probes: Exchange, SQL Server, Oracle, Oracle ASM
• File Analytics Probes
Note: Do not enable HBA probes for VMware guest host collection.
To configure probes for a host
1. Search for hosts in your inventory. A search with no specified criteria returns all hosts in your inventory.
2. Mouse over each of the Probe icons at the right of the Host Inventory list to view the probe type.
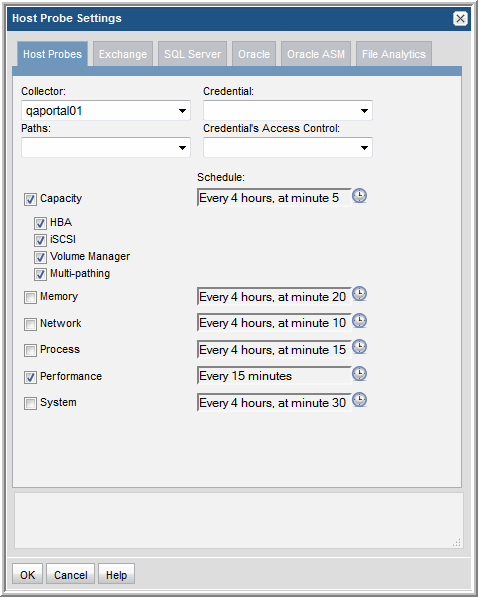
3. Double-click a host in the inventory or select a host and click
Edit Probes to configure/view the Host Probe Settings window. For details see
Probe Settings.
Probe settings must be configured to ensure successful communication with the hosts. In addition, the frequency of each probe can be customized.
4. Click each tab to updated the configuration settings for the specific probes.
5. For the SQL Server and Oracle probes, you can create multiple instances, using the following steps:
a. Click Add.
c. Click OK.
Host Inventory File Analytics Probe
Using Host Resources data collection, hosts are discovered and added to the Host Inventory. Once a host is listed in the inventory, it can be selected and the File Analytics probe can be configured. To access the Host Inventory to enable File Analytics probes: Admin > Data Collection > Host Inventory
Note that by design, File Analytics host resources data collection occurs via activation of the probe in the Host Inventory window in the Portal. Collection does not occur under the following circumstance:
• The Validate option in the Portal’s Host Inventory window only runs a connectivity check. It does not collect File Analytics data.
File Analytics Probe Configurations by Operating System
Windows servers: A Data Collector must be running on a Windows 2008 server. A Domain Administrator ID is required when collecting file-level data for File Analytics.
Linux servers: Only Linux is supported (Solaris, Linux, and AIX, but not HP-UX), with the following requirements:
• Root user access is supported.
• Non-root user access with sudo access control is supported.
• Non-root user access without sudo is not supported.
• Running collection with a sudo user on a Linux server requires the addition of a an access control command for the server in the Host Inventory’s Manage Access Control window:
Admin > Data Collection > Host Inventory
Also, an advanced parameter must be created: FA_USE_SUDO set to Y.
To access Advanced Parameters in the Portal, select Admin > Advanced > Parameters.
Both Windows and Linux Servers
If running collection via the checkinstall utility, verify the following:
• An advanced parameter must be created: FA_HOST_VALIDATE set to Y.
To access Advanced Parameters in the Portal, select Admin > Advanced > Parameters.
Best Practices for Host Inventory File Analytics Probes
• File Analytics should be configured to run daily for all hosts/servers.
• Since most environments have hundreds, even thousands of hosts, it is recommended that File Analytics probes be configured in a staggered schedule so as not to overload the Data Collector server.
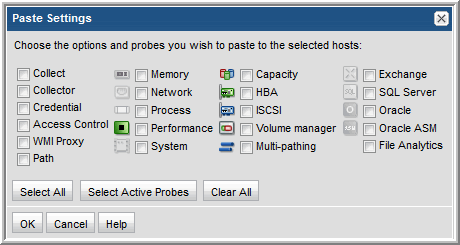
Propagate Probe Settings: Copy Probes, Paste Probes
Whenever you have hosts with common attributes, you can save time by configuring probe settings for one host and then copying and pasting those settings to other hosts.
A key advantage to using the probe copy/paste feature is the ability to propagate the probe schedules to multiple hosts. In addition, you can explicitly select the probes you want to activate.
Note: You only can copy/paste probes that are within the same Domain. This mainly impacts Managed Services Providers with multi-domain environments. Use the Advanced Search function to list probes within a specific Domain.
Example of Probe Copy/Paste
1. Search for all Linux hosts.
2. Configure the probes for one of the hosts in your Linux list and click Copy Probes.
3. Finally, select the remaining Linux hosts and click Paste Probes.
• The icons of configured Probes will be highlighted in the Paste Probes window; however, you must explicitly check those probes to copy the probe schedules and to activate the probes. Use the Select Active Probes button to select active probes.
• By default, the probe checkboxes will be unchecked, enabling you to explicitly select the probes that you want to paste. Or, click Select All to turn on all the probes for the selected host.
Probe Settings
Table 13.3 Probe Settings
Probe Type | Parameters | Description |
Capacity HBA iSCSI Volume Manager Multi-pathing Note: Do not enable HBA probes for VMware guest host collection. | Probe schedule* | A schedule in cron format; for example: */20 9-18 * * * which translates to “every 0, 20 and 40th minute past the 9, 10, 11, 12, 13, 14, 15, 16, 17 and 18th hour.” |
Memory | Probe schedule* | A schedule in cron format; for example: */20 9-18 * * * which translates to “every 0, 20 and 40th minute past the 9, 10, 11, 12, 13, 14, 15, 16, 17 and 18th hour.” |
Network | Probe schedule* | A schedule in cron format; for example: */20 9-18 * * * which translates to “every 0, 20 and 40th minute past the 9, 10, 11, 12, 13, 14, 15, 16, 17 and 18th hour.” |
Process | Probe schedule* | A schedule in cron format; for example: */20 9-18 * * * which translates to “every 0, 20 and 40th minute past the 9, 10, 11, 12, 13, 14, 15, 16, 17 and 18th hour.” |
Processor | Probe schedule* | A schedule in cron format; for example: */20 9-18 * * * which translates to “every 0, 20 and 40th minute past the 9, 10, 11, 12, 13, 14, 15, 16, 17 and 18th hour.” |
System | Probe schedule* | A schedule in cron format; for example: */20 9-18 * * * which translates to “every 0, 20 and 40th minute past the 9, 10, 11, 12, 13, 14, 15, 16, 17 and 18th hour.” |
Exchange | Collect | Check this box to activate collection on an on-going basis. When it is unchecked, only initial validation will attempt this probe. |
Probe schedule | A schedule in cron format; for example: */20 9-18 * * * which translates to “every 0, 20 and 40th minute past the 9, 10, 11, 12, 13, 14, 15, 16, 17 and 18th hour.” |
Active Directory Host | Host name or address |
Active Directory Port | For example: 389 |
Active Directory Base DN* | The starting point for the Active Directory. For example: CN=Services,CN=Configuration,
DC=contoso2003,DC=com Several tools are available to help you identify the Base DN: |
Active Directory User Name | Active Directory User Name This username must have privileges to search under the base DN within the Active Directory. Typically, this is an Administrator. |
Password | Active Directory Password |
SQL Server | Collect | Check this box to activate collection on an on-going basis. When it is unchecked, only initial validation will attempt this probe. |
Probe schedule | A schedule in cron format; for example: */20 9-18 * * * which translates to “every 0, 20 and 40th minute past the 9, 10, 11, 12, 13, 14, 15, 16, 17 and 18th hour.” |
Database* | The name of the database within the SQL server. |
Instance | The system identifier to identify the SQL server database instance—for example: BKUPEXEC. Specify either an instance name or a port. If an instance name is not specified, MSSQLSERVER is substituted. |
Port | To identify the SQL server instance, provide either an instance name or a database port number; for example: 1433. If a port number is not specified, the port is determined automatically from the instance name. |
Account* | Database access user name The data collector requires a user account with permissions to execute the stored procedures |
Password* | Database access password |
Windows Authentication | Check this box if you want Windows authentication rather than SQL server authentication. |
Oracle | Collect | Check this box to activate collection on an on-going basis. When it is unchecked, only initial validation will attempt this probe. |
Probe schedule | A schedule in cron format; for example: */20 9-18 * * * which translates to “every 20 minutes between the hours of 9 a.m. and 6 p.m.” |
SID* | The system identifier to identify the database instance. |
Port* | Database port number; default: 1521 |
Username* | The Oracle user must have the following role granted: SELECT_CATALOG_ROLE To grant this access, use: GRANT SELECT_CATALOG_ROLE TO ‘user’ where user is the database Username that you’ll provide here. |
Password* | Database access password |
Oracle ASM | Collect | Check this box to activate collection on an on-going basis. When it is unchecked, only initial validation will attempt this probe. |
Probe schedule | A schedule in cron format; for example: */20 9-18 * * * which translates to “every 20 minutes between the hours of 9 a.m. and 6 p.m.” |
Account* | The Oracle user privileges required: SYSDBA privilege if 10g sysasm in 11g |
Password* | Database access password |
Port* | Database port number; default: 1521 |
ASM Instance* | The name that identifies the database instance. |
File Analytics | Collect | Check this box to activate collection on an on-going basis. When it is unchecked, only initial validation will attempt this probe. |
Probe schedule | Default is once a month. A schedule in cron format; for example: */20 9-18 * * * which translates to “every 20 minutes between the hours of 9 a.m. and 6 p.m.” |
| |