Configure a Table Dynamic Template
To view the steps to create a tabular Dynamic Template, see
Dynamic Template Designer Quick Start.
To get started with examples of out-of-the-box templates, see
Examples of Tabular Dynamic Templates.
Examples of Tabular Dynamic Templates
The best way to learn how to define a bar chart report template is to learn by example.
The following list includes a sampling of the out-of-the-box reports that are shipped with the product, along with a few examples of the relevant information to help you isolate an example of the functionality that you are trying to implement.
To help you identify a field in the template that contains this functionality, the following convention is used in the list of report templates.
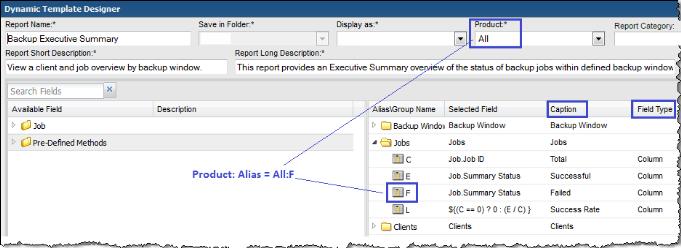
• Product:Alias combines the values listed in the template. In the following example, the selected Product is All, while the selected Alias is F.
• Some templates are vendor product-specific, in which case you may have a Product:Alias such as EMC Avamar:A
Report Template | Report Type | Product: Alias | Caption | Field Type | Functions |
Backup Manager Reports |
Backup Executive Summary | Table | All: E | Successful | Column | DECODE, SUM |
Job Summary | Table | All: L | Start Date | Column | |
Monthly Backup Summary | Table | All: E | Last Full Backup | Column | |
Capacity Manager Reports |
Array Executive Summary | Table | All: C | Usable Internal Capacity | Hidden | SUM, NVL |
| | All: K | Replica | Column | SUM, NVL |
Array Port Utilization | Table | All: L | Port Nbr | Hidden | TO_CHAR |
Array Utilization Summary | Table | All: H | Used Capacity | Column | NVL |
LUN Utilization Summary | Table | All: F | Device Nbr | Hidden | TO_CHAR, LPAD |
Create a Sparkline Chart in a Tabular Dynamic Template
A sparkline presentation of the data can be added as a column to a tabular report to plot a series of values. Sparklines enable an at-a-glance view of data spikes that may indicate an issue that requires attention.
The basic requirements for a sparkline chart in a Dynamic Template include:
• Table template type. Sparklines are embedded in a table cell.
• Data over time. Scope Selector should have a Time Period component if you want to see values over time.
• Comma-separated list of string values. Use the aptStringConcat function to achieve this.
• Field Configuration Formatter: Select either Area Sparkline or Column Sparkline.
• Method. A Method may provide an efficient way of including a sub-query (WITH clause) to supply a series of values to be rendered by the sparkline.
Example of a Client Backup Sparkline Chart in a Dynamic Template
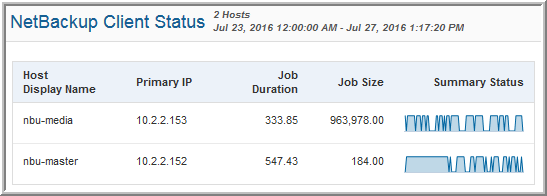
The following example provides a sparkline chart to represent backup job failures over time.
To achieve this report’s backup client status results, the following settings were configured:
• The client’s host name and IP address are included to retrieve data from the database.
• Job Duration contains a SUM function.
• Job Size contains a SUM function.
• Summary Status contains an aptStringConcat function.
• Summary Status has the Area Sparkline formatter selected in the Field Configuration.
• Time Period is selected in the Scope Selector.
Example of Using a Method to Create a Sparkline Chart in a Dynamic Template
The following example illustrates how to create a method to supply re-usable code that can be inserted into a column of a tabular report.
To add a sparkline chart to the Job Summary Dynamic Template, take the following steps.
2. Customize the Job Summary Dynamic Template.
3. From the Pre-Defined Methods folder, open the Client Failure Sparkline folder.
4. Drag the Failure Sparkline field into the report template’s list of fields.
5. Configure the Failure Sparkline field and select a Column Sparkline formatter.
6. Click Save As and supply your own report name to be saved into a specified folder.
Client Failure Sparkline Method
To enable a sparkline to be dropped into a backup job report, a user-defined method for a Job enterprise object needs to be created with the following elements. See also,
Overview of Method Creation.
• With Clause
with spark as (
select trunc(start_date), client_id, client_name, count(job_id) failed_count
FROM apt_v_job
WHERE client_id in(${hosts})
AND start_date between ${startDate} AND ${endDate}
AND summary_status = 2
group by client_id, client_name, trunc(start_date)
)
• Query
select client_id, client_name, aptStringConcat(failed_count) failed_count
from spark s
group by client_name, client_id
• Join
apt_job.client_id = ClientFailureSparkline.client_id (+)
• Fields
CLIENT_NAME - Check this field so that it can be included in a Dynamic Template.
FAILED_COUNT - Check this field so that it can be included in a Dynamic Template.
CLIENT_ID - Do not check this field as it is only needed for the method’s code.


