Configure a Donut Chart Dynamic Template
A Donut Chart is similar to a Pie Chart.
Example of a Donut Chart Dynamic Template
Donut charts require both a caption field and a numeric sector field. To create sectors for a non-numeric field, such as OS name, you simply can configure a Count function to render the count of the instances of the value.
2. Drag or double-click fields to add them to the pane at the right of the window. Typically, you will need only a caption field and a sector field.
3. Sector Field: Double-click the field to configure it as a Donut sector.
4. Caption Field: Double-click the field to configure it as a caption.
5. Select the Sector field and click Functions.
6. In the Function Builder window, click Add and select a COUNT function to count the instances of the value to return a decimal that can be graphed as a donut sector.
7. For this example, the Donut Chart should include the following fields and field types.
8. Be sure to complete the other mandatory fields for the template: Report Name, Short Description, and Long Description.
9. Click Define Scope Selector to configure the Maximum legends for Pie/Donut Chart. Overwrite the default value with the maximum that you want to see.
10. Save the Report Template.
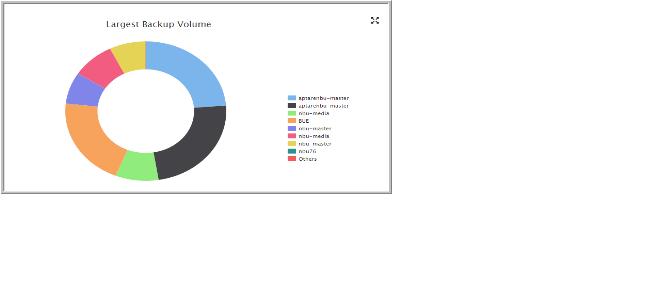
11. Generate the report from the Report Template.
The report will look something like this: