VM Datastore Overview
The Inventory provides an accurate picture of objects discovered by APTARE StorageConsole within your enterprise. This interface displays asset counts from collected data, and provides access to multiple targeted reports that you can select to display. This overview page shows overview information for all collected Datastores in your datacenter.
Datastore information is visualized with the following reports:
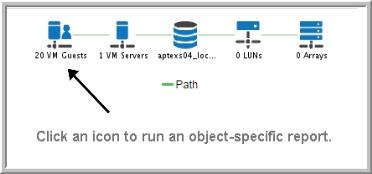
Connectivity between objects is shown in a topology diagram. Each object displays the type and the count. You can click the object and drill down into a related report.
See also
Exploring Your Inventory for general information and functionality.
Interacting with Reports on the Overview Page
Many interactive features are available depending on the report type:
• Time series - zoom and reset zoom: On a series of time-based data points, using the mouse, drag select a section of the chart to zoom. Click the Reset zoom button to return to your original settings.
• Time series – zoom and pan: Once you’ve zoomed on a series of time-based data points, you can scroll left and right through the chart.
• Expand to full screen: Charts displayed as components of a dashboard may be hard to read. Click the Expand icon to pop the chart out of the dashboard and have it displayed in the full browser window.
• Show/hide data series: The legend displays the data series in a chart with a symbol and the name of the series. Click a value in the legend to add or remove the data point from the chart. The chart automatically updates based on the addition or removal.
• Column sorting: Click any column header on a tabular chart to sort the table by that column.
• Hyperlink drill downs: Drill down to a more granular level by clinking links in the report. This feature is available for all chart types.
• Expanding sectors: Click parts of a pie and donut charts to have sections emphasized without changing the data.
Report Type | Interactive Feature |
Tabular | • Hyperlink drill downs • Column sorting • Expand to full screen |
Bar (all types) | • Time series - zoom and reset zoom • Time series – zoom and pan • Expand to full screen • Show/hide data series • Hyperlink drill downs |
Line | • Time series - zoom and reset zoom • Time series – zoom and pan • Expand to full screen • Show/hide data series • Hyperlink drill downs |
Area | • Time series - zoom and reset zoom • Time series – zoom and pan • Expand to full screen • Show/hide data series • Hyperlink drill downs |
Pie/Donut | • Expand to full screen • Show/hide data series • Hyperlink drill downs • Expand sectors |
Gauge | • Expand to full screen |
Working with the Action Menu in the Inventory View
Many functions available to standard reports and templates are available to the reports in the Inventory Navigator.
• Inventory Reports: Edit Scope - Your selection in the Hierarchy Panel sets the objects which are part of the scope. For some objects and object groups, you can edit additional parameters.
Edit Scope is only shown when there are parameters available to change. A default time period is also set for those reports that require one. Use the Hierarchy Panel to revise the scope when the menu item is not displayed. See
Report Scope for details.
• Inventory Reports: Save As - When you save a report, you are saving a copy of the report into the
Reports tab,
not the report output. You can save a version in your Reports. Scope selections are saved with the report. See
Saving Reports for details.
Note: Some reports provided by the Inventory are specialized and not available from the Reports tab. Due to the nature of these reports, they function like Detail reports and cannot be customized or saved, as they are specific to the report from which they were derived. Save As is not displayed for these reports.
• Inventory Reports: Email - After you generate a report and it renders, you can choose to instantly email the report. Emailed reports are not derived from the cache. These events are run in real time, so current data is always used. You can email a report to yourself, other individuals, or a distribution list. Scheduling reports to be regularly emailed is not available from the
Inventory tab. See
Emailing Reports and Dashboards for details.
• Inventory Reports: Export - You can export reports to make them available to external applications, such as Microsoft Excel or if you’d like to generate a hardcopy, you can export them to a file, such as a PDF. Exported reports are not derived from the cache. These events are run in real-time, so current data is always used. See
Exporting Reports and Dashboards for details.
• Inventory Reports: Filter - In addition to the filtering that happens with your hierarchy selection, table-formatted reports can be further filtered on Rows and/or Columns, using advanced filtering. You can define the criteria for the data rows displayed in a report. Drop-down lists enable selections from the available columns. Next, you supply the operator—such as
equals or
does not contain—and a value for that column. Up to 16 selections can be joined to form the filter. See
Advanced Filtering for Tabular Reports for details.
VM Datastore Overview
The datastore is the container for the VMs and their configuration files, virtual disks, and other files, such as the ISO files that are used for installing a virtual machine. A datastore provides the virtual storage resources via mapping to physical storage on DAS SCSI, FC SAN arrays, iSCSI, or NAS drives. The datastore is the storage provisioning source for one or more VMs on one or more hosts.
Datastore Usage Breakdown
The Datastore Usage Breakdown provides an interactive pie chart of the file types comprising each datastore. The usage value for Non-VM Files includes metadata—system files that comprise system overhead. The legend displays the data series in a chart with a symbol and the name of the series. Click a value in the legend to add or remove the data point from the chart. The chart automatically updates based on the addition or removal. Click parts of the pie chart to have sections emphasized without changing the data.
Datastore Usage History
The Datastore Usage History shows a time-based series chart that visualizes the capacity, average usage and maximum usage size for datastores. You can roll-over the data points to display specific sizes and the related date.
On a series of time-based data points, using the mouse, you can drag-select a section of the chart to zoom. Click the Reset zoom button to return to your original settings. Once you’ve zoomed on a series of time-based data points, you can scroll left and right through the chart.
Datastores Utilization Summary
The Datastore Utilization Summary gives you the ability to identify what storage is in use and where it is located. Click any column header on a tabular chart to sort the table by that column. You can drill down to a more granular level by clinking links in the report.
Click the datastore Name link to view the Datastore Detail where you can view the Extents and then link to the corresponding Physical Disk Detail. In addition, the Datastore Detail provides a link to the array from which the storage has been provisioned.
Topology Path
Click an icon in the topology path to drilldown into a related report.
Datastore Disk Read/Write Performance
A line chart represents disk read/write performance metrics for VM Datastores. It is displayed as datastore size in GiB over time.
Datastore Disk Latency Performance
A line chart represents disk total latency performance metrics in Ms for VM Datastores. It is displayed as datastore size in GiB over time.