Working in the Reports Tab
The Reports view panel allows you to browse, view, run and manage StorageConsole Out-of-the-Box report templates, as well as your own custom reports. This area provides a single, consolidated view with relevant details and the ability to navigate to originating files. As you manage templates and reports, it’s important to understand how they are related to other reports and how they are shared with other users. You can quickly assess this information from the Reports view panel.
StorageConsole enables you to use different navigation methods to slice and examine your collected data. You can explore the data by using parts of your IT infrastructure as the entry point or by using the APTARE customizable templates to provide a clear picture into your storage environment. The
Inventory Navigator serves as browser mode for your infrastructure. See
Exploring Your Inventory.
New Badge
APTARE periodically publishes new or updated report templates and makes them available automatically. Folders may be badged with a
NEW flag to indicate that new or updated report templates are available in your system. See
About Badging.
About Caching
When you run a report, StorageConsole takes the scope of the report, and checks if the cache contains the same report, for the same scope. If it does, the results are displayed from the cache. If the combination does
not exist, the report is run from the database, saved in the cache, and then sent to the user interface. Cached reports are shared across users who belong to the same home host group. When a report is served from the cache, an indicator icon is displayed on reports and dashboards. You can roll over the indicator to show the age of the report from the cache. Click the icon to purge the old report from the cache and rerun the report from the database. See also
How Reports and Caching Work Together.
Sections in the Reports Navigation Panel
The
Reports window is divided into sections:
• Home - Contains folders for reports you’ve shared with other users and user groups, folders you’ve created, and the StorageConsole system report template catalog. System report templates refer to general product related report templates. User report templates refer to reports that users have either created using the Dynamic Templates Designer, the SQL Templates Designer or saved from system templates. These folders can also be identified by color. Blue folders contain items that can be edited by users. Yellow folders contain system report templates. See also
Folder Types.
• Shared with Me - Contains a list of reports, dashboards, and templates that other users have shared with you. As the report/folder reader, you are limited in the actions you can perform on the report or folder. Shared reports can be emailed, exported or alerted on. You cannot edit or delete shared reports or folders.
• Cloud - Contains user defined cloud-based report templates. APTARE periodically publishes new or updated report templates and makes them available through the cloud. If this privilege has been enabled for your Portal account, you can view the Cloud section, access, run and save these as they become available in the
Reports tab. Proxy connections are supported for Cloud reports. The
Cloud section and its folders may be badged with a
NEW flag to indicate that new or updated user report templates are available. See also
About Badging. For information about configuring your settings, see
Configure Proxy Server.
• Recent - Displays a list of the 20 most recently run, scheduled in a background run, or modified reports within the last 30 days as limited by your login. Note - if a report has been run and then your access to the report changes, for example through revoked sharing, that report is not displayed in the recent list.
About Badging
APTARE periodically publishes new or updated report templates and makes them automatically available within StorageConsole. There are two types of report templates, system and user. System report templates refer to general product related report templates. User report templates refer to reports that users have either created using the Dynamic Templates Designer, the SQL Templates Designer or saved from system templates. You can quickly identify system versus user folders by color. User folders are blue. System folders are yellow.
The Home section and its folders may be badged with NEW icons to indicate that new or updated report templates are available. Badges on user report folders and templates are visible to every user. Badges on system folders and report templates are only displayed to Super Users.
The Cloud section and its folders may be badged with a NEW icon to indicate that new user report templates are available. This badging is visible to every user with Cloud privileges. The badge is dismissed when a copy is made or saved as a user report template.
Home Section
In the
Home section, badges are displayed on product folders indicating when a template change has been introduced. Badges on user folders are shown only for Cloud templates, that is, those linked to templates in the cloud by users. Badges serve as a visual alert that new or updated report templates are available. For new system templates, the Super User must then enable new reports in the privileges for individuals or user groups. See
Enabling New Product Report Templates.
User report templates copied from the Cloud section into the Home section (My Reports), will also display UPDATED badges if revised versions of a user report template are available from the Cloud.
UPDATED badges are dismissed when you choose to update. NEW badges automatically expire in 14 days. You can customize the display duration for the NEW badge in the portal.properties file.
Cloud Section
The Cloud section in the Reports tab will display a NEW badge to any user with Cloud privileges if a new user report template is available. The badge is dismissed when you copy the report template into your blue user folders or it is saved as a user report template.
See also:
About the Action Bar
In the Reports, the element you select, such as a folder, a report, a template, or a shortcut, determines what operations are made available. For example, a report can be deleted, renamed and shared. A system report template cannot. To make this easier, the Action bar changes when an element is selected, showing you what operations are available based on your selection. Operations are also available through a right-click menu.
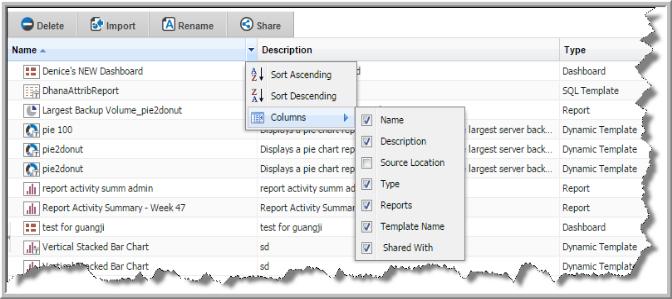
Customizing Your View Panel
The Reports view panel displays multiple columns of information about reports, dashboards and templates. You can choose:
• Which columns are displayed
• Sort order within the column
• Display order of entire columns
You can also choose to show or hide the Details of a report. Some reports contain long descriptions that can be shown by clicking the
Details button. This displays a panel under the inventory list and if available, when a report is selected, displays additional information about the report.
Note: Changes made to any view panel impacts all views within that tab.
Folder Types
In the Home section of the Reports, there are two folder types: system and user. The folders operate similarly, but the functions available with each type differ.
System folders are static and you cannot modify them. System folders contain product specific report templates. User folders can be created, modified, deleted, and shared. User folders contain reports that users have either created using the Dynamic Templates Designer, the SQL Templates Designer or saved from system template.You can further identify system and user folders by color. These folders can also be identified by color. Blue folders contain items that can be edited by users. Yellow folders contain system report templates.
Both System and User folders may display NEW badges when new or updated report templates are available. Badge display is controlled by privileges and roles.
As you select a folder, the available functions are displayed on the action bar.
Report Template Icons
Icons are used to represent report template types. You can quickly determine if a report will be produced as a dashboard, table, pie chart, donut chart, line chart or bar chart by the icons and roll-over help. These icons may display stamps to convey additional information. For example, shortcuts can be distinguished from the original file by the arrow that appears on the icon. This allows you to quickly scan lists of reports and make business decisions based on visual indicators.