Monitoring Data Collectors
Refer to the following sections to monitor the health and status of your Data Collectors.
Data Collection Task Overview
A Data Collector regularly queries your enterprise objects for specific information, and each information type is called a collection task. Each collection task runs at specific intervals, and not all collection tasks run at the same intervals.
A collection task does not always return data because sometimes there isn’t any data to return. However, when the collection task returns data, this historical information is used to determine the collection task’s activity pattern or threshold.
Backup Collection Tasks
Most collection tasks run between every 20 minutes to 24 hours. However, one collection task, the Backup Job Completed Event, can post data several times a second at the height of the backup window, thereby setting the historical period for posting data to a very short interval. Subsequently, when the backup window is closed and no backups are being performed, the status monitoring might indicate an alert for this data collection component. If you have a backup window with heavy activity and then no or little activity, you may encounter some false positives for this component. If this component indicates it has not captured any data for more than 24 hours, then the component likely indicates an issue that requires investigation.
Backup Event Data Collector
The Event Data Collector is the software component responsible for capturing backup event data. It is started for the following subsystems: Commvault Simpana, EMC Data Domain, EMC NetWorker, HP Data Protector, and Veritas Backup Exec. This event collection is logged to enable troubleshooting and isolation of collection issues, by processing thread. You can access the logs via the Support Tools utility:
Admin > Advanced > Support Tools. See also,
Data Collector Log Files for a description of the log file naming convention.
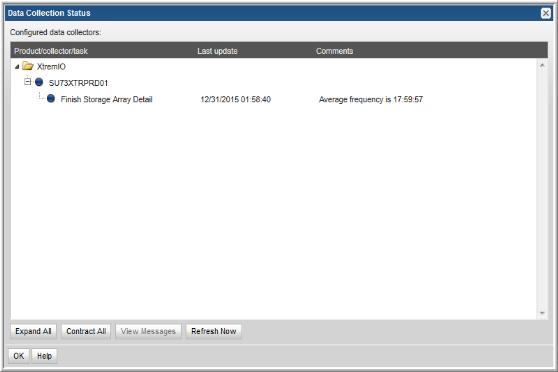
Monitor Data Collector Status
You can monitor data collection from a single window. This functionality is very useful if your environment contains more than one backup solution or collectors for multiple enterprise objects.
1. Select Admin > Data Collection > Status.
2. Click Expand All.
The last update and status from the individual collectors are aggregated up to the Data Collector level. Collectors can be shown or hidden using the +/- icon.
Colored indicators illustrate four possible states:
* Blue - The task is operating within correct thresholds.
* Amber - The task is operating outside of the usual thresholds, but is still operational.
* Red - The task has failed.
* White - There is no data for the task.
The parent collector will display a red status if:
• Data has not been collected in the expected time interval.
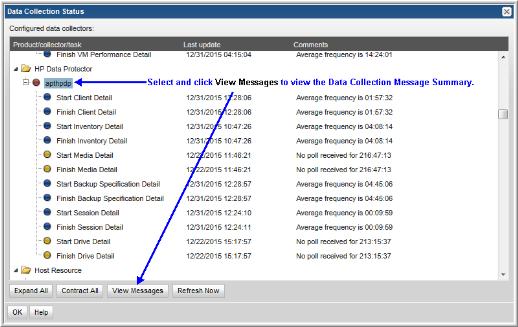
3. Check for exceptions in the Data Collector log files by selecting a collector in the Data Collection Status window and clicking View Messages.
Note: Currently, messages are available only for EMC Avamar, EMC NetWorker, HP Data Protector, and Capacity Manager Host Resources. Therefore, the View Messages button will not be accessible for other types of messages.
Troubleshoot Data Collectors
The status icons, described in
Monitor Data Collector Status, provide an indication of the health of the Data Collector. A red status does not necessarily indicate a data collection failure, as the parent collector will display a
red status if there are two or more child tasks that are in an
amber warning state.
Further analysis of Data Collectors can be achieved using the following steps.
1. Verify that Data Collector processes are running on the Data Collector host.
2. Use the following System Administration reports to check the status of Data Collection:
• Collection Message Summary
• Data Collection Schedule Summary
• Data Collector Status Summary
• File Analytics Collection Status
3. Use the Support Tools utility to download and inspect data collection logs:
Admin >Advanced > Support Tools. See also,
Data Collector Log Files for a description of the log file naming convention.