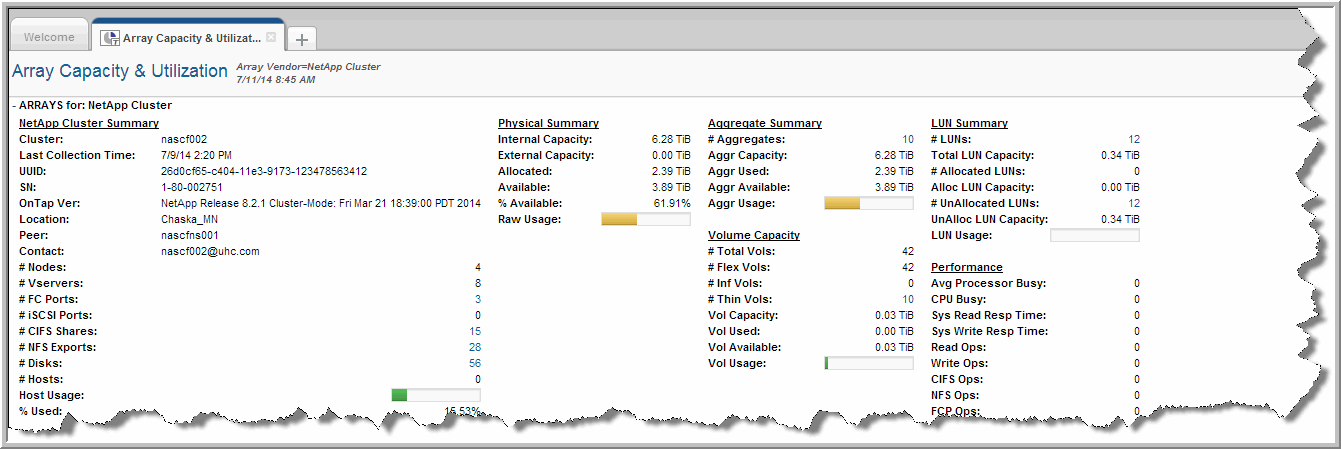
Because NetApp Cluster mode uses a number of unique constructs—such as Aggregates and Volumes—to organize and access its storage, additional data is available through drilldowns.


Cluster | NetApp Cluster name. |
Last Poll Time | Date/Time of the last successful or partially successful collection cycle. |
UUID | Product designator of NetApp instance (universally unique identifier). |
SN | Serial number of the storage array. |
ONTAP Ver | Version of ONTAP as of the last data collection. |
Location | User designated. Free-form field describing the relative location of the cluster in the user’s environment. |
Peer | Peer cluster name. |
Contact | Primary contact information for the cluster. |
# Nodes | Number of configured nodes in the cluster. Drill down to the NetApp Cluster-Mode Node Summary. |
# Vservers | Number of configured Vservers. Drill down to the Vserver Summary report. |
# FC Ports | Sum of all member nodes’ FC ports. Drill down to the Array Port Utilization reports for these ports. |
# iSCSI Ports | Sum of all member nodes’ iSCSI ports. Drill down to the NetApp LUN Utilization Summary. |
# CIFS Shares | Sum of all member nodes’ CIFS shares. Drill down to the NetApp CIFS report. |
# NFS Exports | Sum of all member nodes’ NFS exports. Drill down to the NetApp NFS report. |
# Disks | Sum of all member nodes’ disks. Drill down to the NetApp Disk Summary report for these disks. |
# Hosts | Total number of connected hosts via all configured nodes. Drill down to the Host Capacity and Utilization report for these hosts. |
Host Usage | Amount of logical capacity associated with host connections. Drill down to LUN Utilization Summary for these LUNs. |
% Used | Percentage of used capacity associated with LUNs allocated to hosts. |
Internal Capacity | Sum of all disk drive capacities associated with individual member nodes. |
External Capacity | For V-Series only, sum of all the usable capacities of volumes served up by external arrays associated with the V-Series array. |
Virtualized Capacity | 0, Cluster-mode does not virtualize capacity. |
Allocated | Sum of all member nodes’ configured RAID Group capacities in the cluster. |
Available | Represents the physical capacity of the Cluster that potentially could be provisioned in to RAID Groups. Could include customer designated spares. Calculated by subtracting Allocated capacity from Internal Capacity. |
% Available | Percentage of Available Capacity relative to Internal Capacity (not External). |
Raw Usage | Progress bar representing provisioned RAID Groups (including RAID overhead) relative to Internal Capacity. |
# Aggregates | Number of member nodes' aggregates. Drill down to NetApp Aggregate Summary for these aggregates. |
Aggr Capacity | The aggregate’s total size. |
Aggr Used | Amount of the aggregate’s capacity in use. |
Aggr Available | Available storage in the aggregate. |
Aggr Usage | Used data storage at the physical layer. Mouse over the thermometer bar to view the % available. |
# of Total Vol(ume)s | Sum of all member nodes’ volumes. Drill down to NetApp Volume Summary for these volumes. |
# FlexVols | Sum of all member nodes’ thinly provisioned volumes (FlexVols). Drill down to NetApp Volume Summary for these volumes. |
# Inf Vol(ume)s | Sum of all member nodes’ infinite volumes. Drill down to NetApp Volume Summary for these volumes. |
# Thin Vol(ume)s | Sum of all member nodes’ volumes with Space Guarantee of none. Drill down to the NetApp Volume Summary for these volumes. |
Vol(ume) Capacity | Used data storage at the physical layer. Mouse over the thermometer bar to view the percent available. |
Vol(ume) Used | Total of used space for all the associated volumes. |
Vol(ume) Available | Available capacity from all of the associated volumes. |
Vol(ume) Usage | Used data storage at the logical layer. Mouse over the thermometer bar to view the percent available. |
# LUNs | Sum of member nodes’ FC and iSCSI LUNs. Drill down to LUN Utilization Summary for these LUNs. |
Total LUN Capacity | Total storage capacity for all of the associated LUNs. |
# Allocated LUNs | The number of LUNs on the array that have been mapped to a host. These LUNs are typically configured as volumes on the host and dedicated to an application. Drill down to LUN Utilization Summary for these LUNs. |
Alloc LUN Capacity | The total storage capacity for the allocated LUNs. |
# UnAllocated LUNs | The number of LUNs that have yet to be allocated. |
UnAllocated LUN Capacity | The available LUN capacity. |
LUN Usage | % of LUN capacity that is currently in use. |
Avg Processor Busy | Average processor utilization across all processors in the system from last data collection cycle. |
CPU Busy | Percentage of time one or more processors is busy in the system from last data collection cycle. |
Sys Read Resp Time (ms) | System Read Response Time: Average response time for the Cluster in aggregate as of the last data collection poll. Includes all active Node read operations. |
Sys Write Resp Time (ms) | System Write Response Time: Average response time for the Cluster in aggregate as of the last data collection poll. Includes all active Node write operations. |
Read OPS | Read operations per second from the last data collection cycle. |
Write OPS | Write operations per second from last data collection cycle. |
CIFS OPS | CIFS operations per second from last data collection cycle. |
NFS OPS | NFS operations per second from last data collection cycle. |
FCP OPS | Fibre channel protocol (FCP) operations per second from the last data collection cycle. |
iSCSI OPS | iSCSI operations per second from the last data collection cycle. |