Job Volume Summary Report
Use Search to find a template, report or dashboard by name. Search is case insensitive, supports partial entries, and will display a list of potential matches.
As you enter the name in the Search field, up to 10 potential matches are displayed. If the template, report or dashboard is shown, you can select and run it directly from the match list. You can also click All Items in the match list to go directly to the Search Results.
StorageConsole provides different navigation options to slice and examine your collected data. You can explore the data by using the APTARE customizable report templates or by using parts of your IT infrastructure as entry points. The Inventory Navigator serves as a browser for your infrastructure by object type. See also
Exploring Your Inventory.
Use the Reports tab to examine the StorageConsole catalog of templates, dashboards and reports - organized by products along with user-created, and system folders. This report is located here:
Backup Manager > Management Reports > Job Volume Summary
The
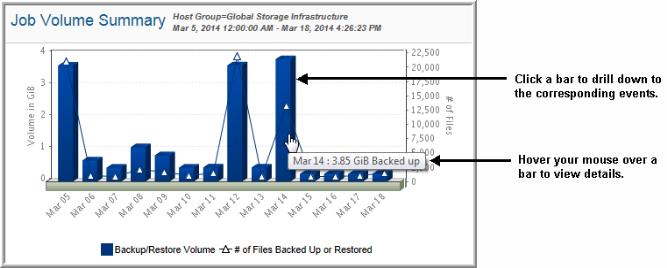
Job Volume Summary report shows the number of files and amount of data that you backed up for a specified time period. While the
Data Domain Backup Summary report approaches the data from an “event status” point of view, the
Job Volume Summary report presents data from the perspective of “how much” has been backed up, with a focus on determining if your scheduling is balanced.
The true value of this high-level report is its ease of use. At a glance—and with a few mouse clicks—you can ascertain problematic time periods, consumption trends, and scheduling peaks.
Use the Scope Selector to filter the report to just the jobs you want to analyze. The Backup Policy Name Filter enables you to enter a backup policy name to analyze job status for a specific policy
Use this procedure to analyze volume usage trends:
2. Mouse-over a triangle at the top of a bar that indicates a peak usage period.
A pop-up displays the number of files that were backed up for that period.
In the Job Summary report, pay attention to the data in the following columns: Duration, Written, MBytes/Sec, Exit Code and Job Status. This data gives you an idea of which jobs have over-tasked your storage. Remember that you can sort the report columns to group jobs that took the longest or that failed.
The Job Volume Summary report provides the following information:
Drillable Bar Chart | Click on any of the bars to go to a Job Summary Report page for the backups that correspond to the time period of the bar that you selected. |
Pop-up Details | Mouse‑over any of the bars or symbols on the chart to display pop-ups that provide details. • Bar: Displays the volume of data backed up for the associated time period. • Triangle symbol: Displays the total number of files backed up. |
Backup Volume | Lists the amount of data backed up. |
Backup Files | Lists the # of files backed up. |