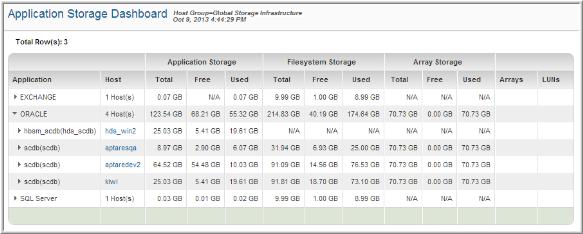
Application Storage Dashboard
Use Search to find a template, report or dashboard by name. Search is case insensitive, supports partial entries, and will display a list of potential matches.
As you enter the name in the Search field, up to 10 potential matches are displayed. If the template, report or dashboard is shown, you can select and run it directly from the match list. You can also click All Items in the match list to go directly to the Search Results.
StorageConsole provides different navigation options to slice and examine your collected data. You can explore the data by using the APTARE customizable report templates or by using parts of your IT infrastructure as entry points. The Inventory Navigator serves as a browser for your infrastructure by object type. See also
Exploring Your Inventory.
Use the Reports tab to examine the StorageConsole catalog of templates, dashboards and reports - organized by products along with user-created, and system folders. This report is located here:
Capacity Manager > Application Capacity & Utilization > Application Storage Dashboard
This report essentially interrogates the application to identify what storage is free. In addition, this report provides data that can be used to resolve performance issues. The table has three main sections of information: Application Storage, Filesystem Storage, and Array Storage.
| Click the arrow to drill down to a hierarchical Application Sub-Level of the Application Storage Dashboard view. Each subsequent drilldown takes you to the next level of the application, such as the table space and filesystem level. |
Application | The name of the level. For the application level, the name will be specific to the application, such as Exchange or Oracle. If it is the tablespace level, the name of the respective tablespace is displayed. |
Host | The host(s) associated with the application. |
Application Storage Total | Total storage allocated to the application.
App. Used + App. Free = App. Total
The total may not be precise to the decimal, as 1 Kbyte = 1024. |
Application Storage Free | Amount of storage available for the application. In some cases, storage does not need to be pre-allocated to the application, so this field will display as N/A. |
Application Storage Used | Amount of storage consumed by the application. This is the amount of consumed storage as reported by the application. For example, in Oracle within a data file it would display how much space is really being consumed by Oracle. |
Filesystem Storage Total | This total indicates the amount of storage used by the filesystem associated with the application. |
Filesystem Storage Free | Amount of unused and available filesystem storage. Refer to this value to determine if there is space to expand a files system. |
Filesystem Storage Used | Amount of used filesystem storage. |
Array Storage Total | This total indicates the amount of storage used by the array on which this application is located. |
Array Storage Free | Amount of available array storage. |
Array Storage Used | Amount of used array storage. |
Arrays | Storage array; if this field is empty, it means it is a local disk. |
LUNs | A concatenated list of LUNs from which the space is being taken by this application. |
Application Sub-Level of the Application Storage Dashboard
Detail reports are related to a specific enterprise object, such as a backup job or SAN fabric. You can only access detail reports through a link presented in the context of a main report, providing additional information that augments the main report. Detail reports cannot be generated, customized, or saved, as they are specific to the report from which they were derived. Therefore, they will not be available in search results.
Use Search to find the main template, report or a dashboard by name. Search is case insensitive, supports partial entries, and will display a list of potential matches.
As you enter the template, dashboard or report name in the Search field, up to 10 potential matches are displayed. If the result is shown, you can select and run it directly from the match list. You can also select All Items to display the full search results page and further filter your results.
You can use the Reports tab to browse through the StorageConsole templates, dashboards and reports. The navigation pane displays templates organized by products along with user created, and system folders. The main report is located here:
Capacity Manager > Application Capacity & Utilization > Application Storage Dashboard
Click the arrow to view the Application Level detail.
The data displayed in this window is simply the next level within the application—that is, instance-level reporting, as described in
Application Storage Dashboard. At the application sub-level, a host link launches the
Host Utilization Detail.
For example, an Oracle Database Administrator may be interested in managing storage at the tablespace level. Using the Application Storage Dashboard, the administrator can expand the Oracle application to view table space and also filesystem usage. In essence, this view provides the physical implementation of the filesystem, including the LUNs allocated to it.


