Collector Host Name | Name of host where data collector is deployed. Drill down to the Host Details. |
Collector Name | Name of the data collector. |
Product Name | The type of system from which data is being collected, such as EMC VPLEX, Data Domain, or NetApp Cluster. The host name or IP address of the system that is the source of the data is appended to the product name, except for Host Resources collection. |
Probe Type Name | The type of data collection probe, such as Capacity, Performance, or Inventory. |
Schedule | The frequency of the data collection, such as Execute at 12:00 PM Daily. All times are relative to the Data Collector server. |
Last Start Time | The date and time the last data collection started. |
Last End Time | The date and time the last data collection ended. |
Last Duration | Length of the last collection cycle. A color indicator highlights durations that are 50% above the average duration. |
Average Duration | The average duration of all executions of this probe. |
Duration Delta | The % difference between the last duration and the average duration, which is an indicator of collection performance. If the last duration is unknown, the delta will be unknown. |
# of Collections | Number of times the probe successfully collected data within the last 48 hours. |
Total Duration | Total Duration = (# of Collections) * (Average Duration). This column is useful for sorting purposes, to identify long-running collection cycles. |
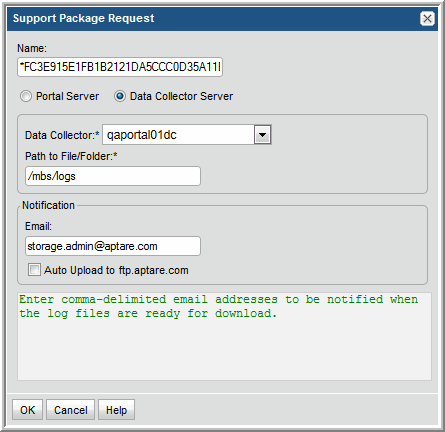
Collector Identifier | This metadata collector ID is useful for correlating collection events with the relevant log files. See also, Example of a Data Collector Log Request. For a VM, instead of a metadata ID, the name of the ESX server is listed in this table column. |
Collected Subsystem | StorageConsole Product | Why the data is not listed in the report |
EMC Avamar | Backup Manager | The Operational Data and Static Data probes do not have start and finish transactions. |
Veritas Backup Exec | Backup Manager | No Backup Exec schedule is available. |
Hitachi Dynamic Tiering | Capacity Manager | No explicit start and finish transactions are collected. |
Brocade Switch Performance | Fabric Manager | No explicit start and finish transactions are collected. |
Cisco Switch Performance | Fabric Manager | No explicit start and finish transactions are collected. |
McData Switch Performance | Fabric Manager | No explicit start and finish transactions are collected. |
File Analytics - NetApp | File Analytics | May be supported in a future StorageConsole version. |
