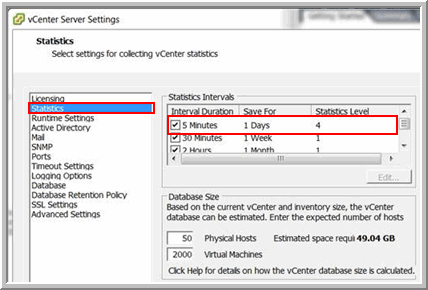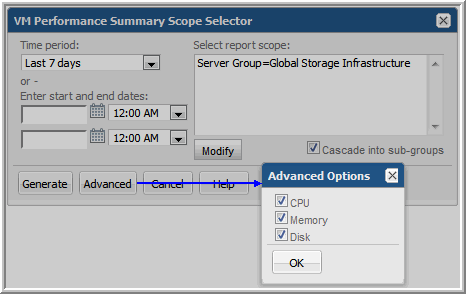
Performance Counters Collected | Statistics Level |
Memory (%) | 2 |
Memory Usage (%) | 1 |
Avg CPU Usage (%) | 1 |
Avg CPU Usage (KB) | 1 |
Disk Avg Usage (KB/sec) | 1 |
Disk Reads (KB/sec) | 2 |
Disk Writes (KB/sec) | 2 |
Disk # of Reads | 3 |
Disk # of Writes | 3 |
Disk Total Latency (ms) | 2 |
Disk Read Latency (ms) | 2 |
Disk Write Latency (ms) | 2 |
Disk Queue Latency (ms) | 2 |
Disk Queue Read Latency (ms) | 2 |
Disk Queue Write Latency (ms) | 2 |
Maximum Queue Depth | 1 |


Name | The name of the VM. Click on this link to view VM Server Details, if it is a host, or VM Detail, if it is a VM. |
Type | Type of partition: host server or VM; Disk Read and Write Latency is available only for ESX Hosts (not VMs). Therefore, latency performance charts are available only for partitions of Type=Host. |
CPU Usage | |
CPU % | The VM’s CPU usage percentage |
CPU Max % | Maximum CPU usage percentage for the report’s Group By interval |
Avg Wait % | Calculated for VM guests based on the total milliseconds for each data capture interval included in the reporting interval, divided by the number of milliseconds in the reporting interval; used to determine how long VM guests wait to get CPU |
Max Wait % | Calculated for VM guests based on the total milliseconds for each data capture interval included in the reporting interval, divided by the number of milliseconds in the reporting interval; used to determine how long VM guests wait to get CPU |
Avg Ready % | Calculated for VM guests based on the total milliseconds for each data capture interval included in the reporting interval, divided by the number of milliseconds in the reporting interval; used to determine how long VM guests wait to get CPU |
Max Ready % | Calculated for VM guests based on the total milliseconds for each data capture interval included in the reporting interval, divided by the number of milliseconds in the reporting interval; used to determine how long VM guests wait to get CPU |
CPU MHz | Average processor speed for the report’s Group By interval |
CPU Max MHz | Maximum processor speed for the report’s Group By interval |
Balloon Memory | |
Min (KB) | Minimum of all the data collection intervals within the report’s time period |
Avg (KB) | Average of all the data collection intervals within the report’s time period |
Max (KB) | Maximum of all the data collection intervals within the report’s time period |
Memory Usage | |
Memory % | Average memory usage percentage for the report’s Group By interval |
Memory Max % | Maximum memory percentage for the report’s Group By interval |
Memory MB | Average memory usage for the report’s Group By interval |
Memory Max MB | Maximum memory usage for the report’s Group By interval |
Disk I/O | |
Disk I/O Data Xfer (KB/sec) | Disk I/O average transfer rate for all disks for the VM |
Disk Read | |
Data Xfer (KB/sec) | Disk read transfer rate, average for the report’s Group By interval |
# Reads | Sum of the number of disk reads for the report’s Group By interval |
Disk Write | |
Data Xfer (KB/sec) | Disk write transfer rate for the report’s Group By interval |
# Writes | Sum of the number of disk writes for the report’s Group By interval |
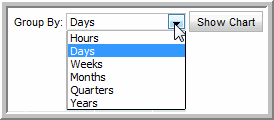
Show Chart | Check the boxes for which you want to generate charts and click Show Chart to view the VM Performance Over Time graphs. Disk Read and Write Latency is available only for ESX Hosts (not VMs). Therefore, the latency performance charts are available only for partitions of Type=Host. See also Show Chart Parameter. |
