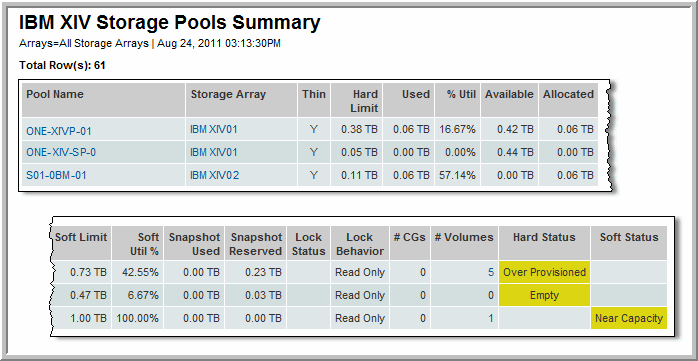


Pool Name | The name of the storage pool links to the XIV Storage Pool Details. |
Storage Array | Name of the XIV array links to the Array Capacity & Utilization report |
Thin | Y = thin provisioning |
Hard Limit | Maximum physical capacity that can be used by volumes and snapshots in the pool |
Used | Physical capacity used by the volumes (see Allocated) + Snapshot Used |
% Util | Used/Hard Limit |
Available | Capacity that is available for allocation |
Allocated | Amount of storage used by volumes; Note that Allocated does NOT include Snapshots. |
Soft Limit | The logical amount of space for all storage pools in the array. A soft limit greater than the hard limit indicates thin provisioning. |
Soft Util % | Soft Util % = Soft limit - Available/Soft Limit |
Snapshot Used | Amount of storage in use by snapshots |
Lock Status | Locked status |
Lock Behavior | Lock behavior, such as Read Only |
# CGs | Number of Consistency Groups associated with this pool, links to the XIV Consistency Group Summary report |
# Volumes | Number of volumes and snapshots associated with this pool, links to XIV LUN Utilization Summary report |
Hard Status | Physical Capacity Status: If % Util < 2% = empty, if % Util > 95% = near capacity, if % Util > 2% and <30% = over-provisioned |
Soft Status | Logical Capacity Status: If % Util < 2% = empty, if % Util > 95% = near capacity, if % Util > 2% and <30% = over-provisioned |