Media Consumption Forecast
Use Quick Search to find a template, report or dashboard by name. Search is case insensitive, supports partial entries, and will display a list of potential matches.
As you enter the name in the Quick Search field, up to 10 potential matches are displayed. If the template, report or dashboard is shown, you can select and run it directly from the match list. You can also click All Items in the match list to go directly to the Search Results.
Use the Explorer to browse through the StorageConsole templates, dashboards and reports. The navigation pane displays templates organized by products along with user created, and system folders. This report is located here:
Backup Manager > Forecasting & Capacity Planning >Media Consumption Forecast
This report is NetBackup-specific.
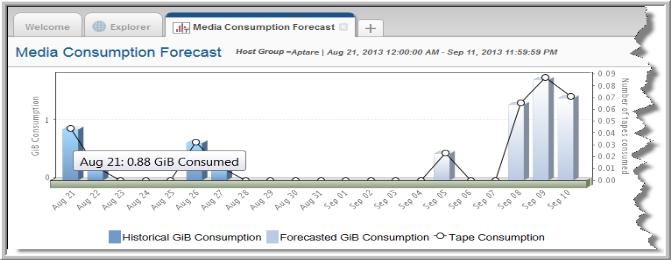
A bar chart represents historical tape usage, with a projection of future needs. You can select report periods ranging from one week to eight weeks of data. In addition, you can narrow the report scope by choosing specific host groups or even clients within a host group.
In order to forecast the seven days of usage, the report averages day-of-the-week consumption data for a historical period specified in the Time Period.
In order to forecast the number of tapes consumed on each day, the report tallies the GByte consumption for all backups written to tape per media type in each volume group. Then the total GByte consumption for that volume group/media type is divided by the estimated capacity of that media type in that volume group. This process is repeated for each volume group/media type instance within the scope of the report and the aggregated tape consumption results are displayed via the circular line symbols in the bar chart.
Note: The current day is treated as the future for the purpose of forecasting.