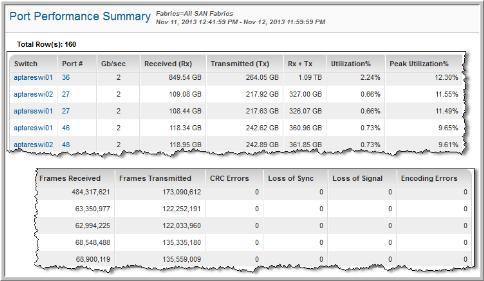
Switch | The name of the Switch in the SAN Fabric. Click the link to view the Switch Details. |
Port # | The number of the port. This is a string, not a numeric field. Click the link to view the Port Performance Details. |
Gb/Sec | The speed of the port. |
Received (Rx) | The number of bytes received within the report’s interval |
Transmitted (Tx) | The number of bytes transmitted within the report’s interval |
Rx+Tx | The total number of bytes transmitted and received within the report’s interval |
Utilization % | The port’s utilization percentage for the reporting interval |
Peak Utilization % | The port’s peak utilization for the reporting interval |
Frames Received | The number of frames received within the report’s interval |
Frames Transmitted | The number of frames transmitted within the report’s interval |
CRC Errors | The number of CRC errors for the report’s interval |
Loss of Sync | The number of loss of sync errors |
Loss of Signal | The number of loss of signal errors |
Encoding Errors | The number of encoding errors |